Exhibit 99.1
Investor Presentation March 2025 Nasdaq: SUNE Powering the Energy Transition Since 2003
2 / Powering the Energy Transition Forward Looking Statements This presentation includes certain forward - looking statements within the meaning of the Private Securities Litigation Reform Act of 1995 , including statements regarding future financial performance, future growth, and future acquisitions . These statements are based on SUNation Energy’s current expectations or beliefs and are subject to uncertainty and changes in circumstances . Actual results may vary materially from those expressed or implied by the statements herein due to changes in economic, business, competitive or regulatory factors, and other risks and uncertainties, including those set forth in the company’s filings with the Securities and Exchange Commission . The forward - looking statements in this presentation speak only as of the date of this presentation . SUNation Energy does not undertake any obligation to update or revise these forward - looking statements for any reason, except as required by law . Non - GAAP Financial Measures This presentation includes non - GAAP financial measures that differ from financial measures calculated in accordance with United States generally accepted accounting principles (“GAAP”). Adjusted EBITDA is a non - GAAP financial measure provided in this presentation, and is n et income (loss) calculated in accordance with GAAP, adjusted for taxes, interest income, interest expense, depreciation, amortization, FV rem eas urement of earnout consideration, FV remeasurement of warrant liability, FV remeasurement of derivative liability, FV remeasurement of CVR, stoc k c ompensation, gain on sale of assets, and loss on extinguishment of debt as detailed in the reconciliation presented in this presentation. These non - GAAP financial measures are presented because the Company believes they are useful indicators of its operating perform ance. Management uses these measures principally as measures of the Company’s operating performance and for planning purposes, including the p rep aration of the Company’s annual operating plan and financial projections. The Company believes these measures are useful to investors as sup ple mental information and because they are frequently used by analysts, investors, and other interested parties to evaluate companies in its indust ry. The Company also believes these non - GAAP financial measures are useful to its management and investors as a measure of comparative operating perf ormance from period to period. These non - GAAP financial measures should not be considered as an alternative to, or superior to, their respective GAAP financial measures, as measures of financial performance or cash flows from operations as a measure of liquidity, or any other performance measure derived in ac cordance with GAAP, and they should not be construed to imply that the Company’s future results will be unaffected by unusual or non - recurring items . In addition, these measures do not reflect certain cash requirements such as tax payments, debt service requirements, capital expenditures and c ert ain other cash costs that may recur in the future. Adjusted EBITDA contains certain other limitations, including the failure to reflect our cash e xpe nditures, cash requirements for working capital needs and cash costs to replace assets being depreciated and amortized. In evaluating non - GAAP financial measures, you should be aware that in the future the Company may incur expenses that are the same as or similar to some of the adjustme nts in this presentation. The Company’s presentation of non - GAAP financial measures should not be construed to imply that its future results will be unaff ected by any such adjustments. Management compensates for these limitations by primarily relying on the Company’s GAAP results in addition to u sin g non - GAAP financial measures on a supplemental basis. The Company’s definition of these non - GAAP financial measures is not necessarily com parable to other similarly titled captions of other companies due to different methods of calculation. Past performance is not indicative of future results. There is no guarantee that any specific objective will be achieved. Inv est ments may be illiquid, highly speculative and there is risk of the total loss of your investment.
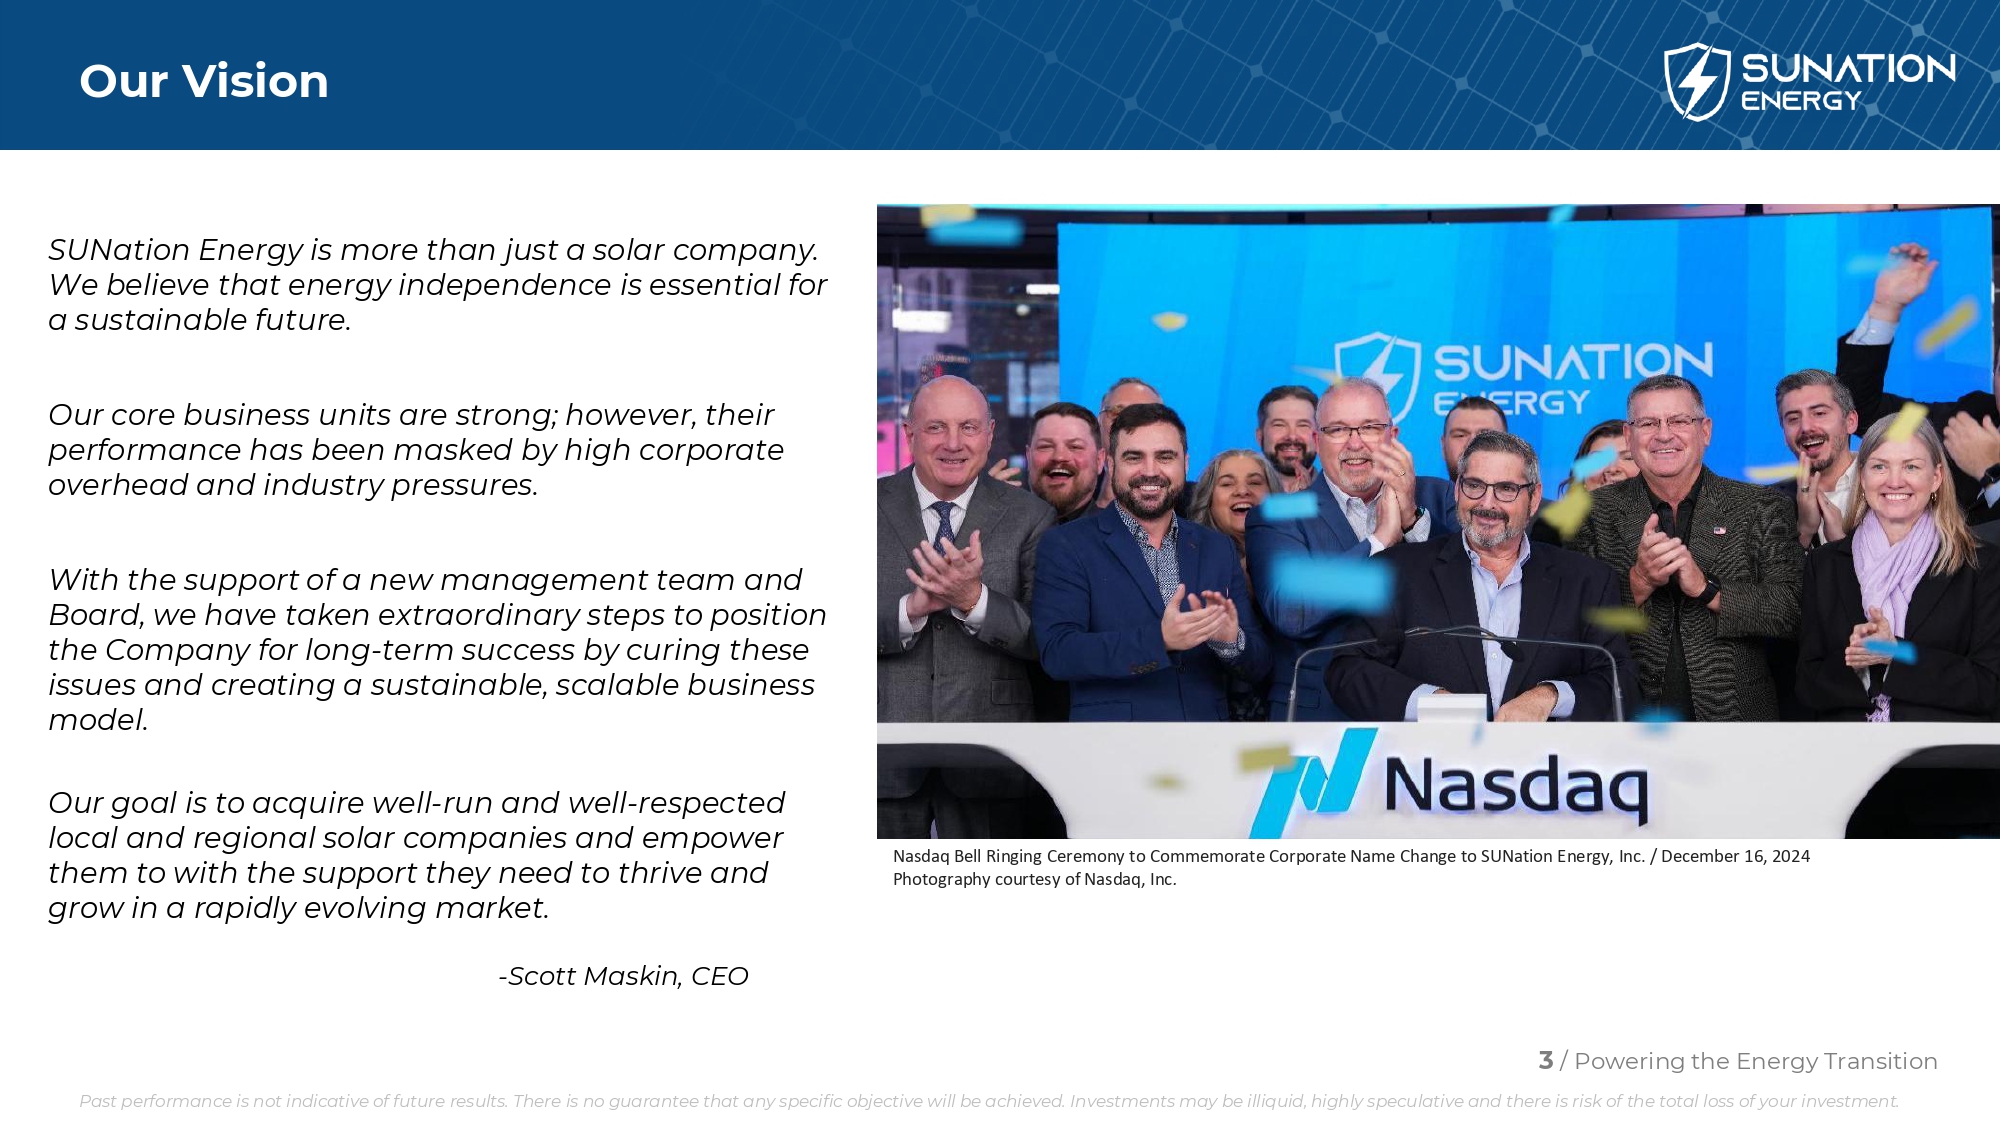
3 / Powering the Energy Transition Our Vision SUNation Energy is more than just a solar company. We believe that energy independence is essential for a sustainable future. Our core business units are strong; however, their performance has been masked by high corporate overhead and industry pressures. With the support of a new management team and Board, we have taken extraordinary steps to position the Company for long - term success by curing these issues and creating a sustainable, scalable business model. Our goal is to acquire well - run and well - respected local and regional solar companies and empower them to with the support they need to thrive and grow in a rapidly evolving market. - Scott Maskin, CEO Nasdaq Bell Ringing Ceremony to Commemorate Corporate Name Change to SUNation Energy, Inc. / December 16, 2024 Photography courtesy of Nasdaq, Inc . Past performance is not indicative of future results. There is no guarantee that any specific objective will be achieved. Inv est ments may be illiquid, highly speculative and there is risk of the total loss of your investment.
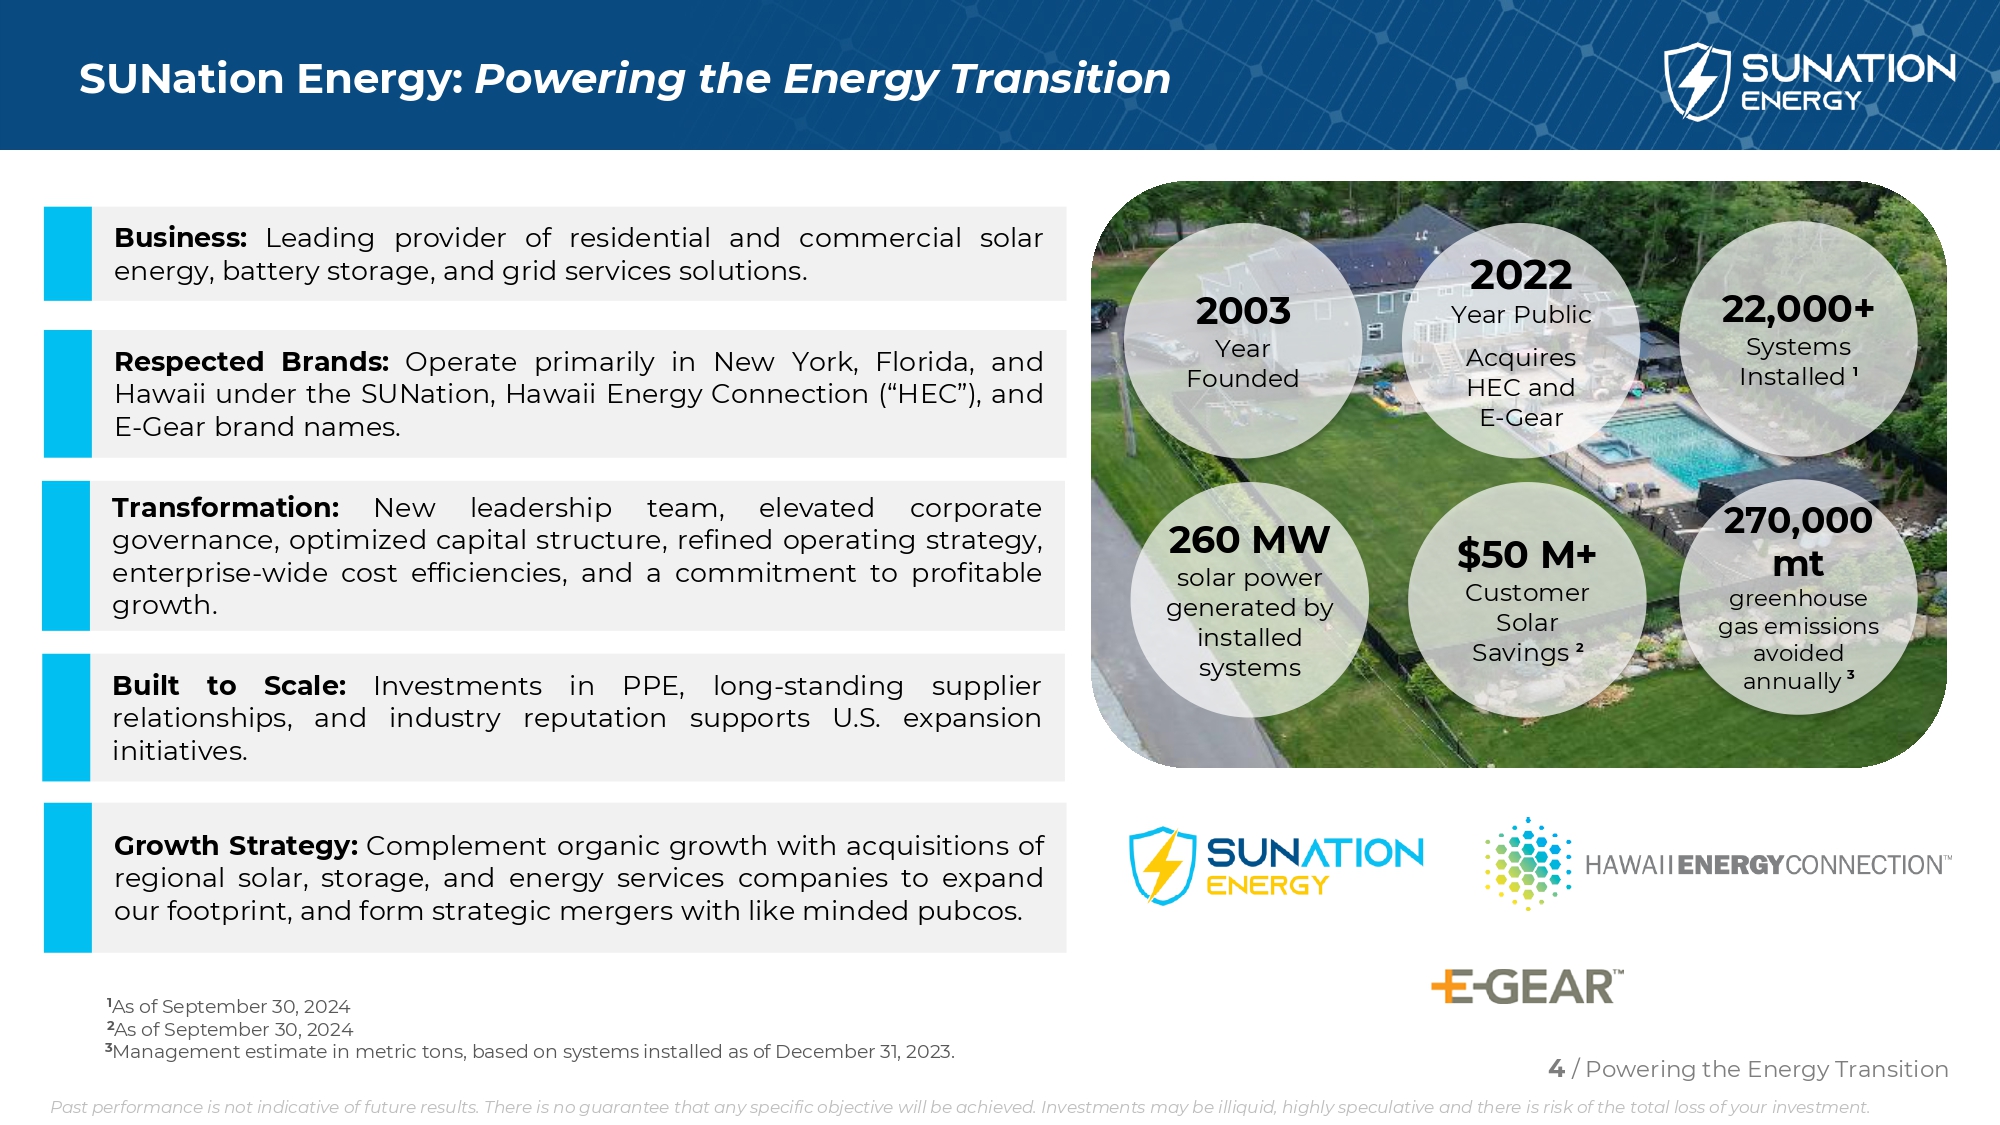
4 / Powering the Energy Transition SUNation Energy: Powering the Energy Transition 2022 Year Public Acquires HEC and E - Gear 22,000+ Systems Installed 1 2003 Year Founded $50 M+ Customer Solar Savings 2 1 As of September 30, 2024 2 As of September 30, 2024 Business : Leading provider of residential and commercial solar energy, battery storage, and grid services solutions . Transformation : New leadership team, elevated corporate governance, optimized capital structure, refined operating strategy, enterprise - wide cost efficiencies, and a commitment to profitable growth . Respected Brands : Operate primarily in New York, Florida, and Hawaii under the SUNation , Hawaii Energy Connection (“HEC”), and E - Gear brand names . Growth Strategy : Complement organic growth with acquisitions of regional solar, storage, and energy services companies to expand our footprint, and form strategic mergers with like minded pubcos . 260 MW solar power generated by installed systems 270,000 mt greenhouse gas emissions avoided annually 3 3 Management estimate in metric tons, based on systems installed as of December 31, 2023. Built to Scale : Investments in PPE, long - standing supplier relationships, and industry reputation supports U . S . expansion initiatives . Past performance is not indicative of future results. There is no guarantee that any specific objective will be achieved. Inv est ments may be illiquid, highly speculative and there is risk of the total loss of your investment.
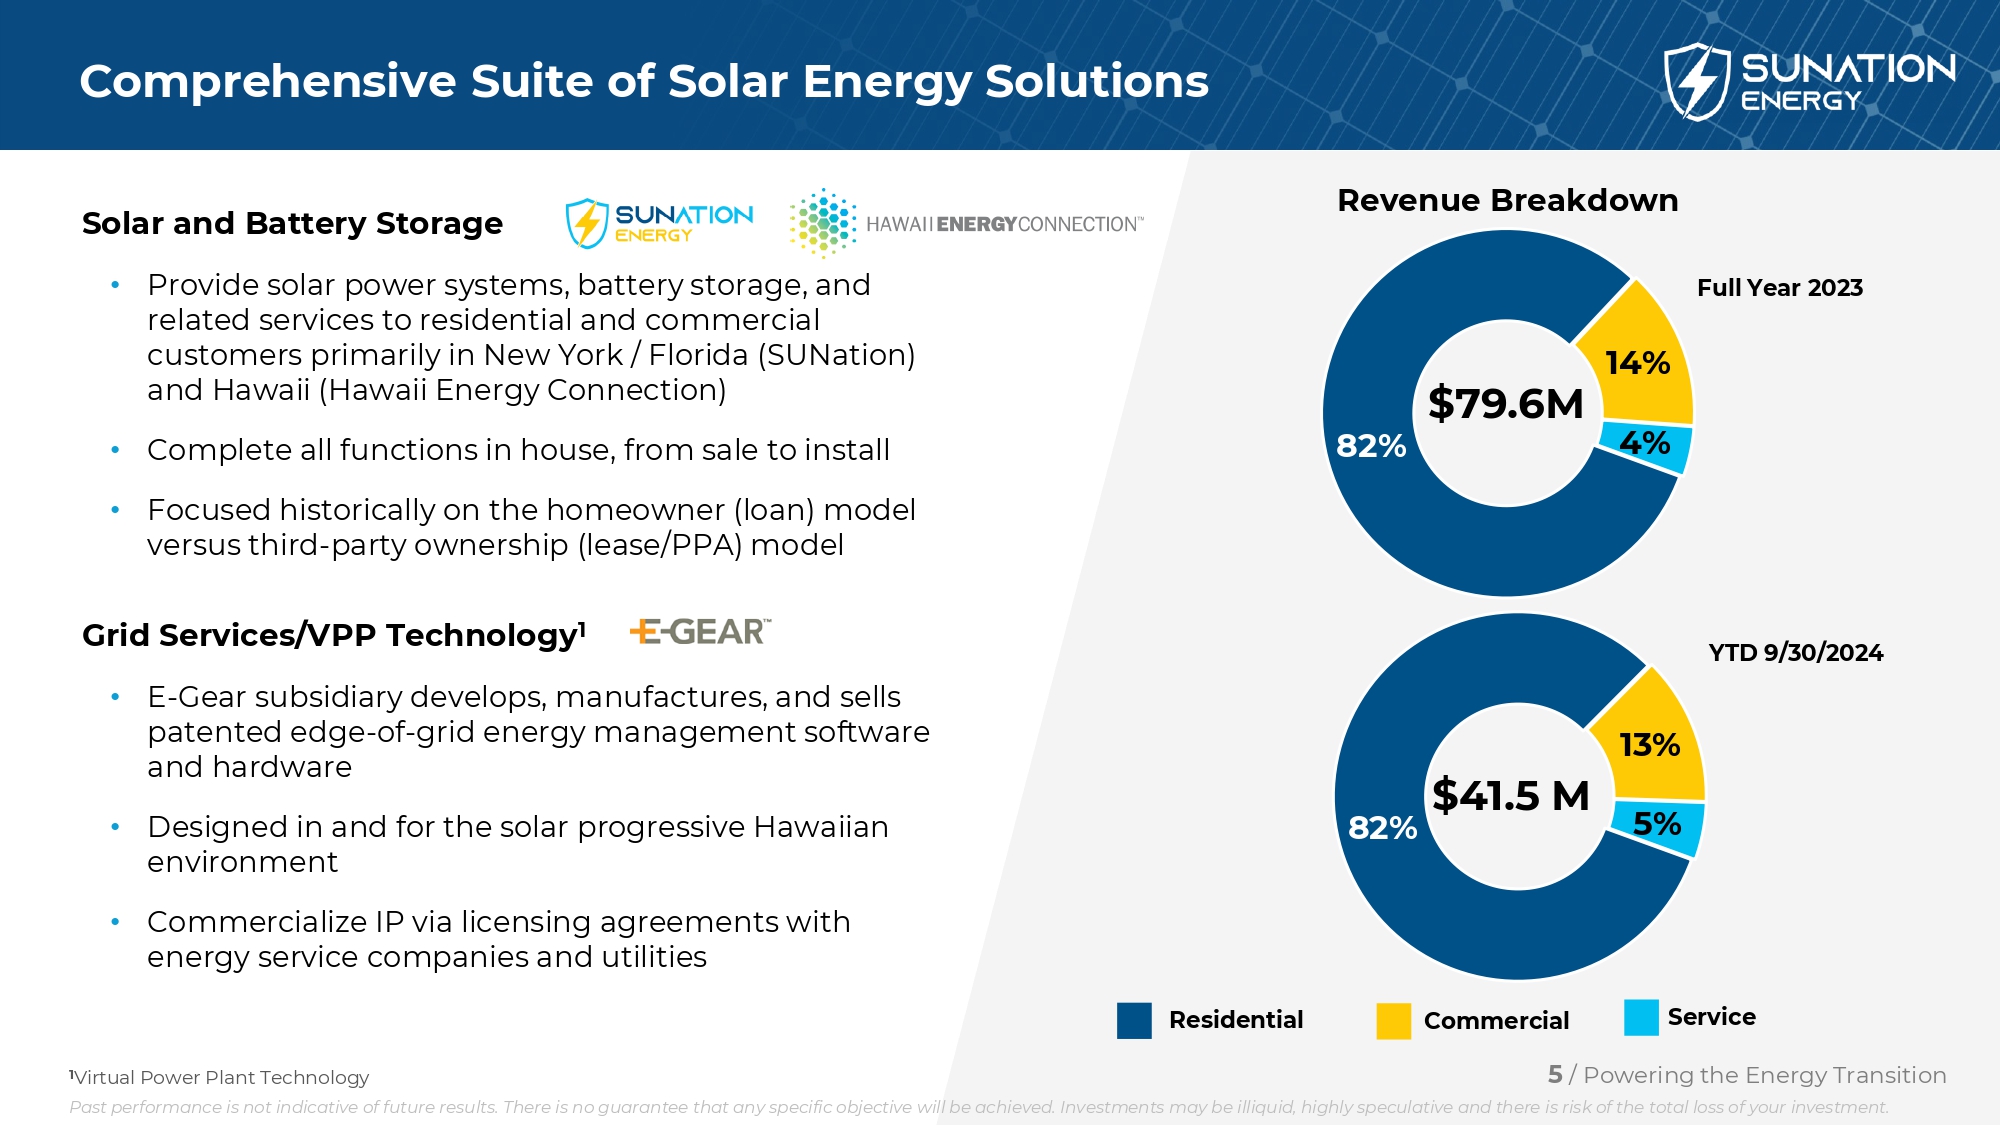
Solar and Battery Storage • Provide solar power systems, battery storage, and related services to residential and commercial customers primarily in New York / Florida ( SUNation ) and Hawaii (Hawaii Energy Connection) • Complete all functions in house, from sale to install • Focused historically on the homeowner (loan) model versus third - party ownership (lease/PPA) model Grid Services/VPP Technology 1 • E - Gear subsidiary develops, manufactures, and sells patented edge - of - grid energy management software and hardware • Designed in and for the solar progressive Hawaiian environment • Commercialize IP via licensing agreements with energy service companies and utilities Comprehensive Suite of Solar Energy Solutions Residential Commercial Service Revenue Breakdown 5 / Powering the Energy Transition 1 Virtual Power Plant Technology 82% 14% 4% $79.6M Full Year 2023 YTD 9/30/2024 $41.5 M 82% 13% 5% Past performance is not indicative of future results. There is no guarantee that any specific objective will be achieved. Inv est ments may be illiquid, highly speculative and there is risk of the total loss of your investment.
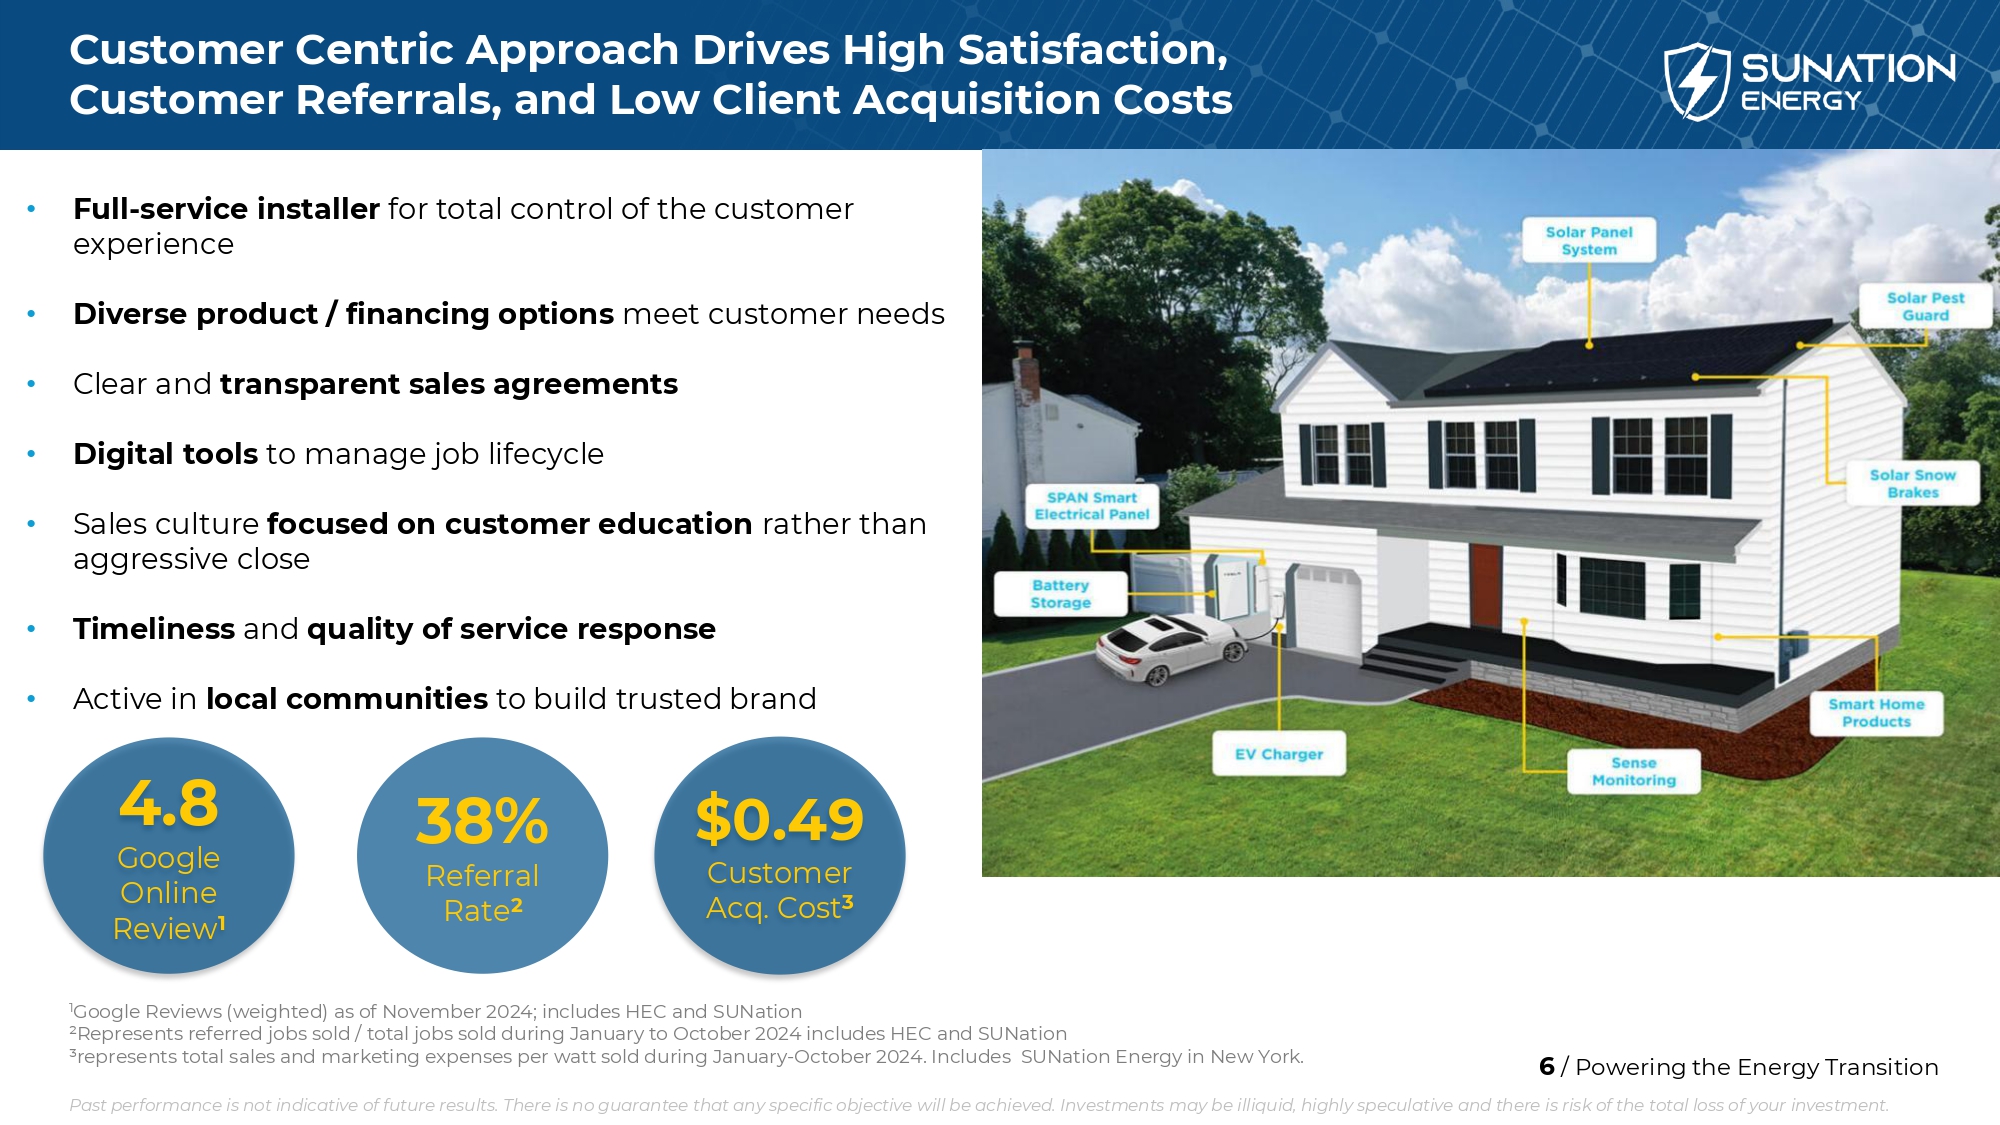
6 / Powering the Energy Transition Customer Centric Approach Drives High Satisfaction, Customer Referrals, and Low Client Acquisition Costs 1 Google Reviews (weighted) as of April 2023 ; includes HEC and SUNation ; ²Represents referred jobs sold / total jobs sold during January to March 2023 ; includes HEC and SUNation ; ³represents total sales and marketing expenses per watt sold during January - December 2022 . Includes HEC and SUNation • Full - service installer for total control of the customer experience • Diverse product / financing options meet customer needs • Clear and transparent sales agreements • Digital tools to manage job lifecycle • Sales culture focused on customer education rather than aggressive close • Timeliness and quality of service response • Active in local communities to build trusted brand 4.8 Google Online Review 1 38% Referral Rate 2 $0.49 Customer Acq . Cost 3 1 Google Reviews (weighted) as of November 2024 ; includes HEC and SUNation ²Represents referred jobs sold / total jobs sold during January to October 2024 includes HEC and SUNation ³represents total sales and marketing expenses per watt sold during January - October 2024 . Includes SUNation Energy in New York . Past performance is not indicative of future results. There is no guarantee that any specific objective will be achieved. Inv est ments may be illiquid, highly speculative and there is risk of the total loss of your investment.
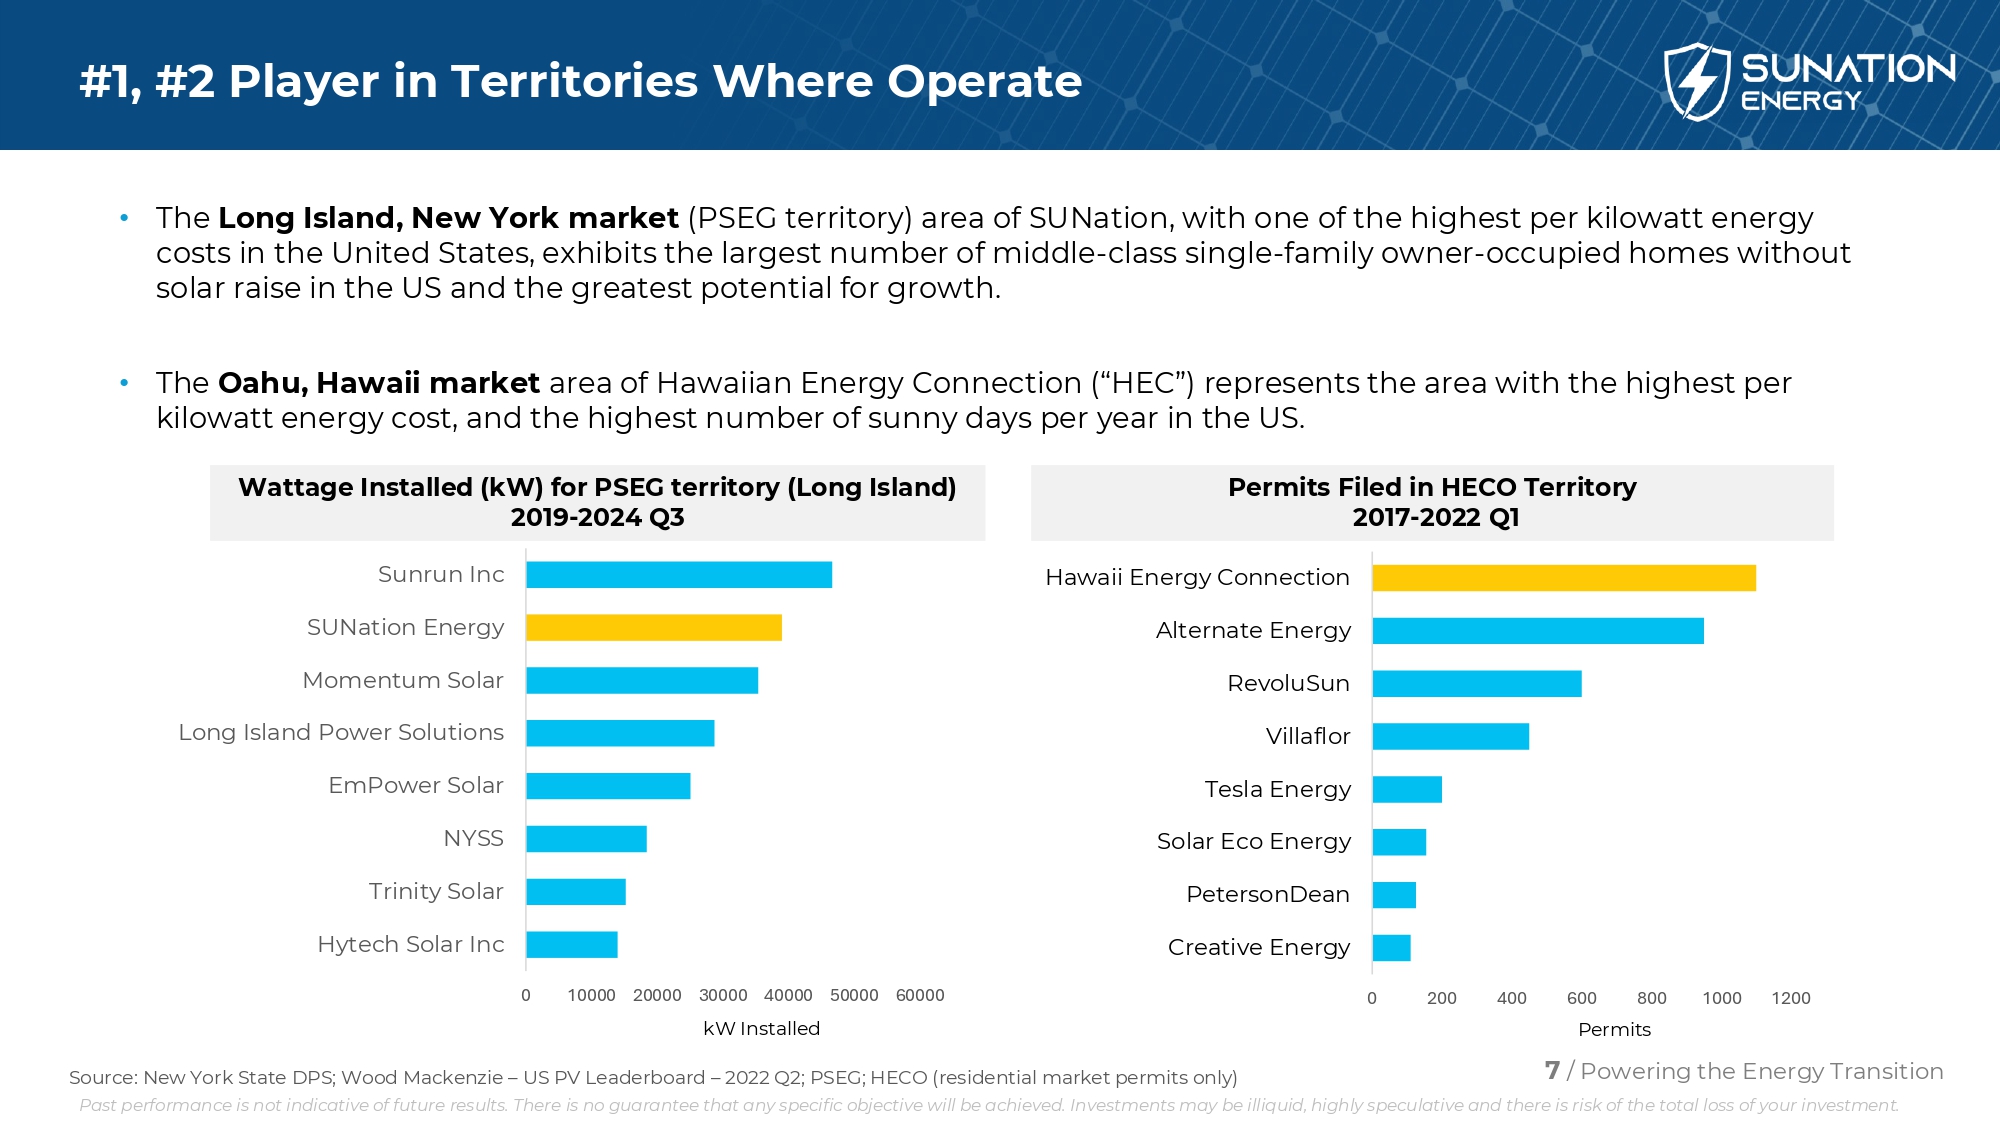
7 / Powering the Energy Transition #1, #2 Player in Territories Where Operate • The Long Island, New York market (PSEG territory) area of SUNation , with one of the highest per kilowatt energy costs in the United States, exhibits the largest number of middle - class single - family owner - occupied homes without solar raise in the US and the greatest potential for growth. • The Oahu, Hawaii market area of Hawaiian Energy Connection (“HEC”) represents the area with the highest per kilowatt energy cost, and the highest number of sunny days per year in the US. 0 10000 20000 30000 40000 50000 60000 Hytech Solar Inc Trinity Solar NYSS EmPower Solar Long Island Power Solutions Momentum Solar SUNation Energy Sunrun Inc Wattage Installed (kW) for PSEG territory (Long Island) 2019 - 2024 Q3 0 200 400 600 800 1000 1200 Creative Energy PetersonDean Solar Eco Energy Tesla Energy Villaflor RevoluSun Alternate Energy Hawaii Energy Connection Permits Filed in HECO Territory 2017 - 2022 Q1 kW Installed Permits Source: New York State DPS; Wood Mackenzie – US PV Leaderboard – 2022 Q2; PSEG; HECO (residential market permits only) Past performance is not indicative of future results. There is no guarantee that any specific objective will be achieved. Inv est ments may be illiquid, highly speculative and there is risk of the total loss of your investment.
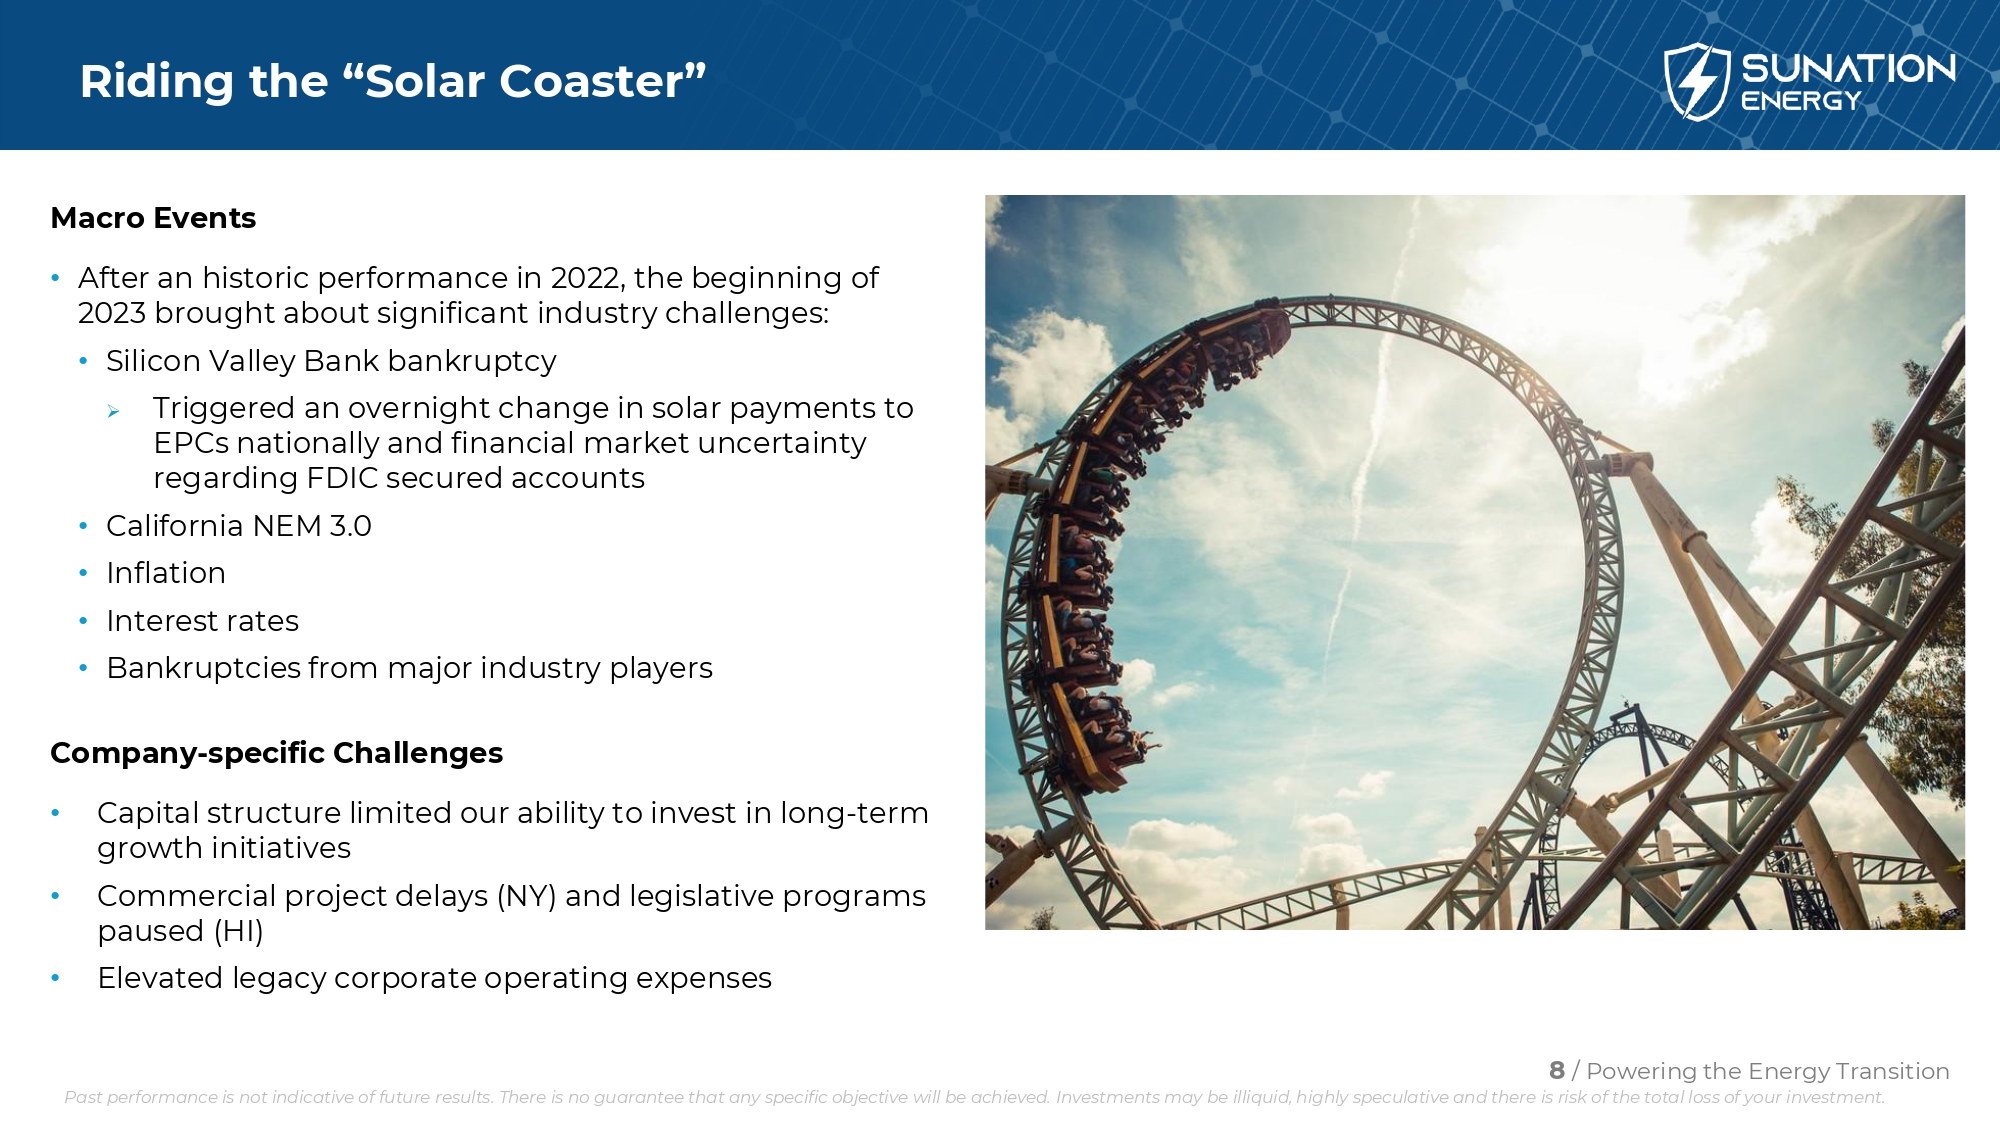
8 / Powering the Energy Transition Riding the “Solar Coaster” Macro Events • After an historic performance in 2022, the beginning of 2023 brought about significant industry challenges: • Silicon Valley Bank bankruptcy » Triggered an overnight change in solar payments to EPCs nationally and financial market uncertainty regarding FDIC secured accounts • California NEM 3.0 • Inflation • Interest rates • Bankruptcies from major industry players Company - specific Challenges • Capital structure limited our ability to invest in long - term growth initiatives • Commercial project delays (NY) and legislative programs paused (HI) • Elevated legacy corporate operating expenses Past performance is not indicative of future results. There is no guarantee that any specific objective will be achieved. Inv est ments may be illiquid, highly speculative and there is risk of the total loss of your investment.
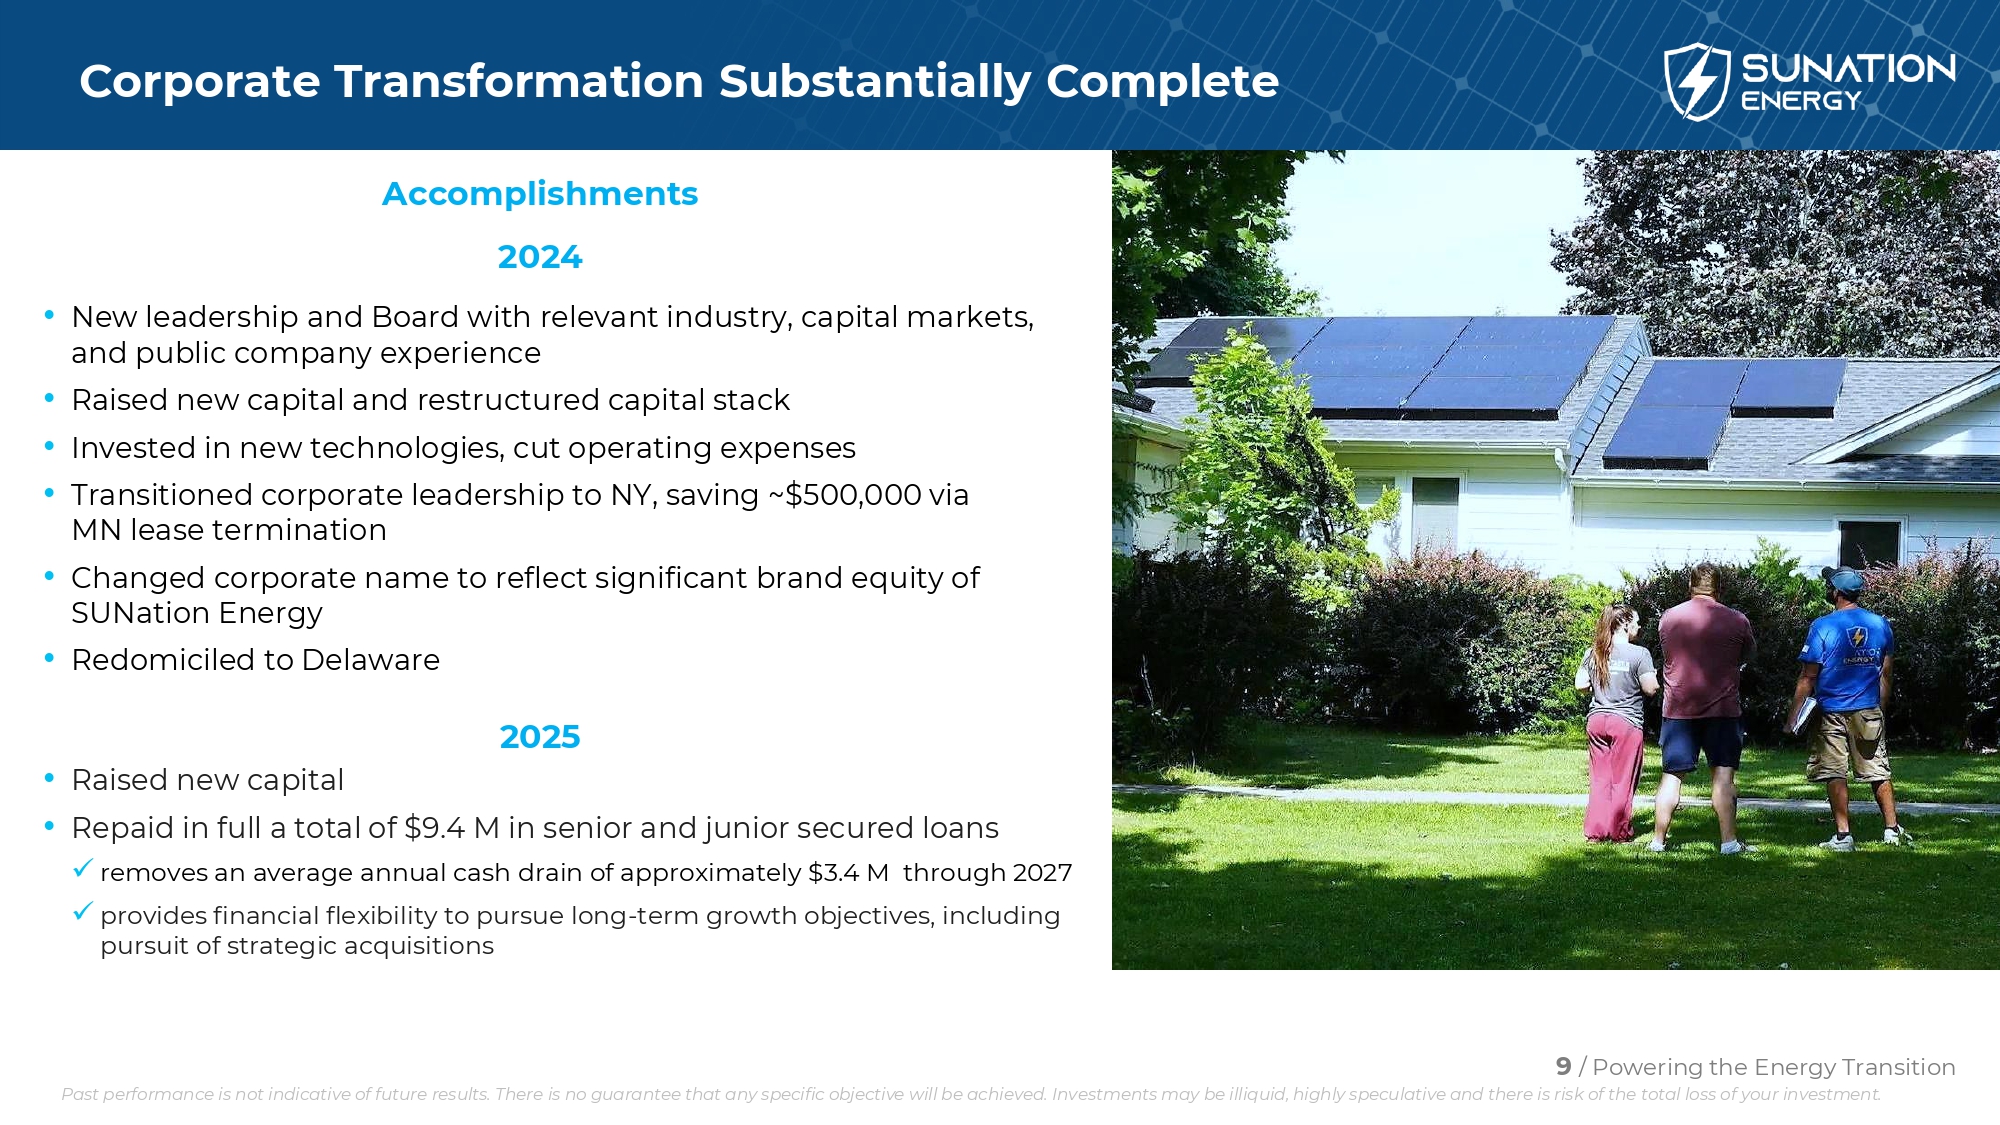
9 / Powering the Energy Transition Corporate Transformation Substantially Complete • New leadership and Board with relevant industry, capital markets, and public company experience • Raised new capital and restructured capital stack • Invested in new technologies, cut operating expenses • Transitioned corporate leadership to NY, saving ~$500,000 via MN lease termination • Changed corporate name to reflect significant brand equity of SUNation Energy • Redomiciled to Delaware • Raised new capital • Repaid in full a total of $9.4 M in senior and junior secured loans x removes an average annual cash drain of approximately $3.4 M through 2027 x p rovides financial flexibility to pursue long - term growth objectives , including pursuit of strategic acquisitions Accomplishments 2024 2025 Past performance is not indicative of future results. There is no guarantee that any specific objective will be achieved. Inv est ments may be illiquid, highly speculative and there is risk of the total loss of your investment.
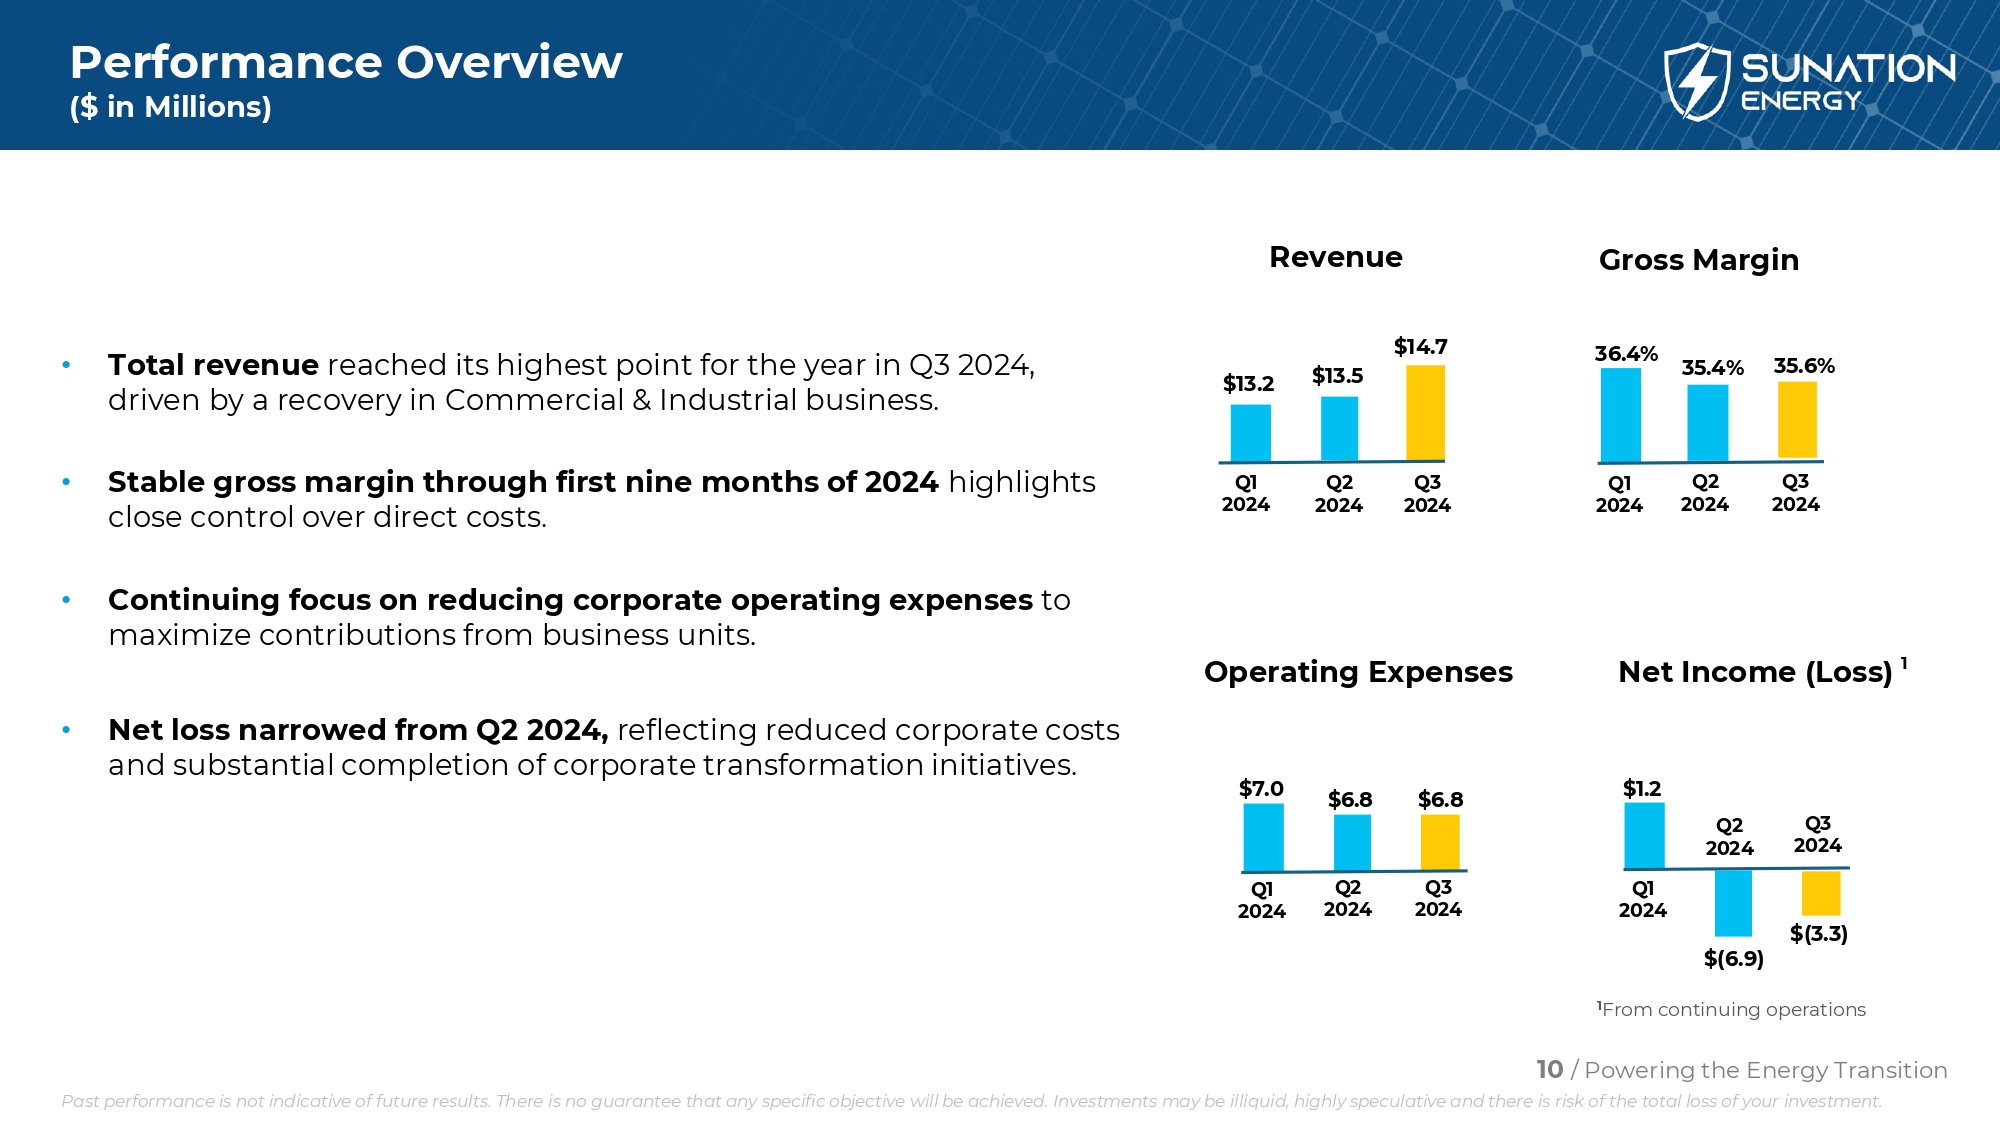
10 / Powering the Energy Transition Performance Overview ($ in Millions) Revenue Gross Margin Operating Expenses Net Income (Loss) 1 1 From continuing operations Q1 2024 Q2 2024 Q3 2024 $13.2 $13.5 $14.7 36.4% 35.4% 35.6% Q1 2024 Q2 2024 Q3 2024 $7.0 $6.8 $6.8 Q1 2024 Q2 2024 Q3 2024 $1.2 $(6.9) $(3.3) Q1 2024 Q2 2024 Q3 2024 • Total revenue reached its highest point for the year in Q3 2024, driven by a recovery in Commercial & Industrial business. • Stable gross margin through first nine months of 2024 highlights close control over direct costs. • Continuing focus on reducing corporate operating expenses to maximize contributions from business units. • Net loss narrowed from Q2 2024, reflecting reduced corporate costs and substantial completion of corporate transformation initiatives. Past performance is not indicative of future results. There is no guarantee that any specific objective will be achieved. Inv est ments may be illiquid, highly speculative and there is risk of the total loss of your investment.
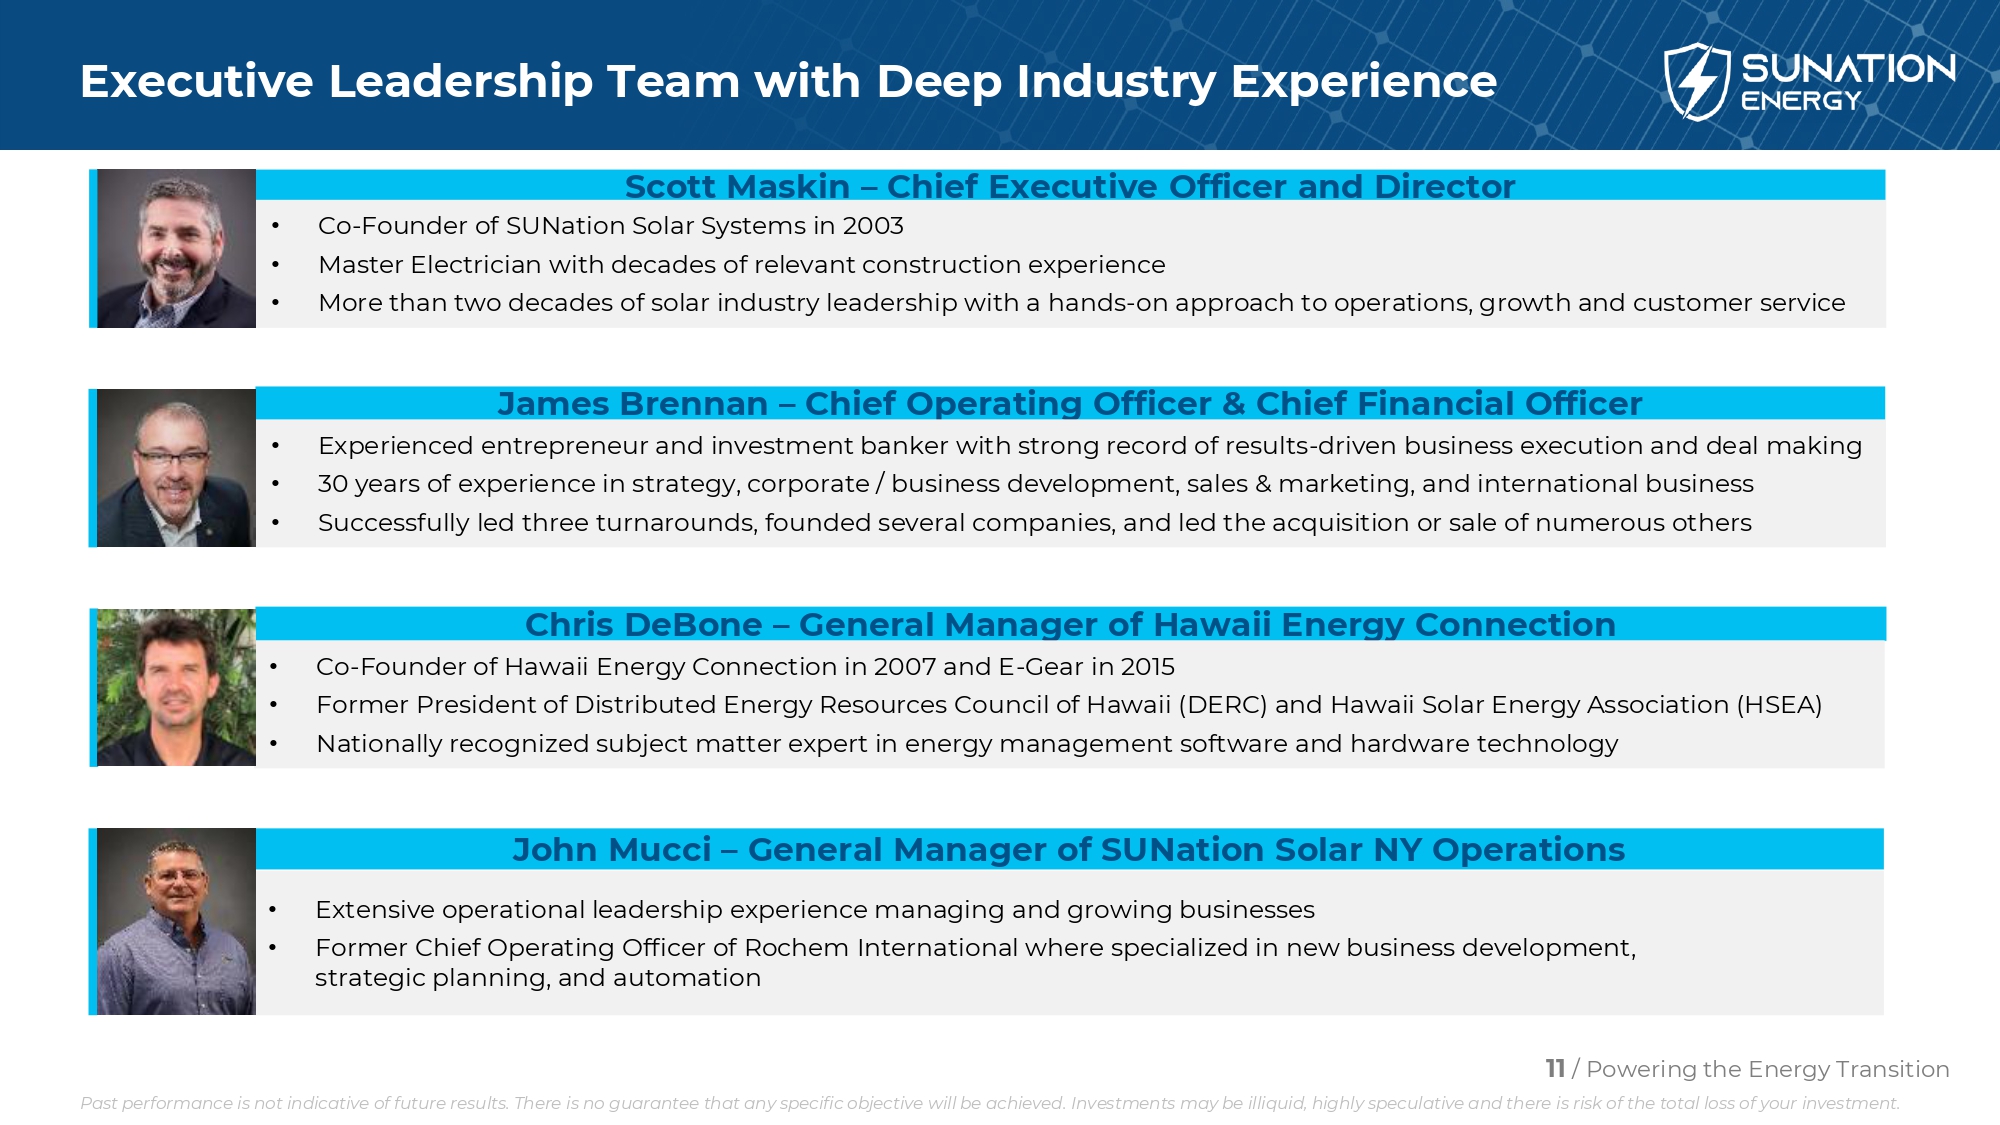
11 / Powering the Energy Transition Executive Leadership Team with Deep Industry Experience Scott Maskin – Chief Executive Officer and Director • Co - Founder of SUNation Solar Systems in 2003 • Master Electrician with decades of relevant construction experience • More than two decades of solar industry leadership with a hands - on approach to operations, growth and customer service James Brennan – Chief Operating Officer & Chief Financial Officer • Experienced entrepreneur and investment banker with strong record of results - driven business execution and deal making • 30 years of experience in strategy, corporate / business development, sales & marketing, and international business • Successfully led three turnarounds, founded several companies, and led the acquisition or sale of numerous others Chris DeBone – General Manager of Hawaii Energy Connection • Co - Founder of Hawaii Energy Connection in 2007 and E - Gear in 2015 • Former President of Distributed Energy Resources Council of Hawaii (DERC) and Hawaii Solar Energy Association (HSEA) • Nationally recognized subject matter expert in energy management software and hardware technology John Mucci – General Manager of SUNation Solar NY Operations • Extensive operational leadership experience managing and growing businesses • Former Chief Operating Officer of Rochem International where specialized in new business development, strategic planning, and automation Past performance is not indicative of future results. There is no guarantee that any specific objective will be achieved. Inv est ments may be illiquid, highly speculative and there is risk of the total loss of your investment.
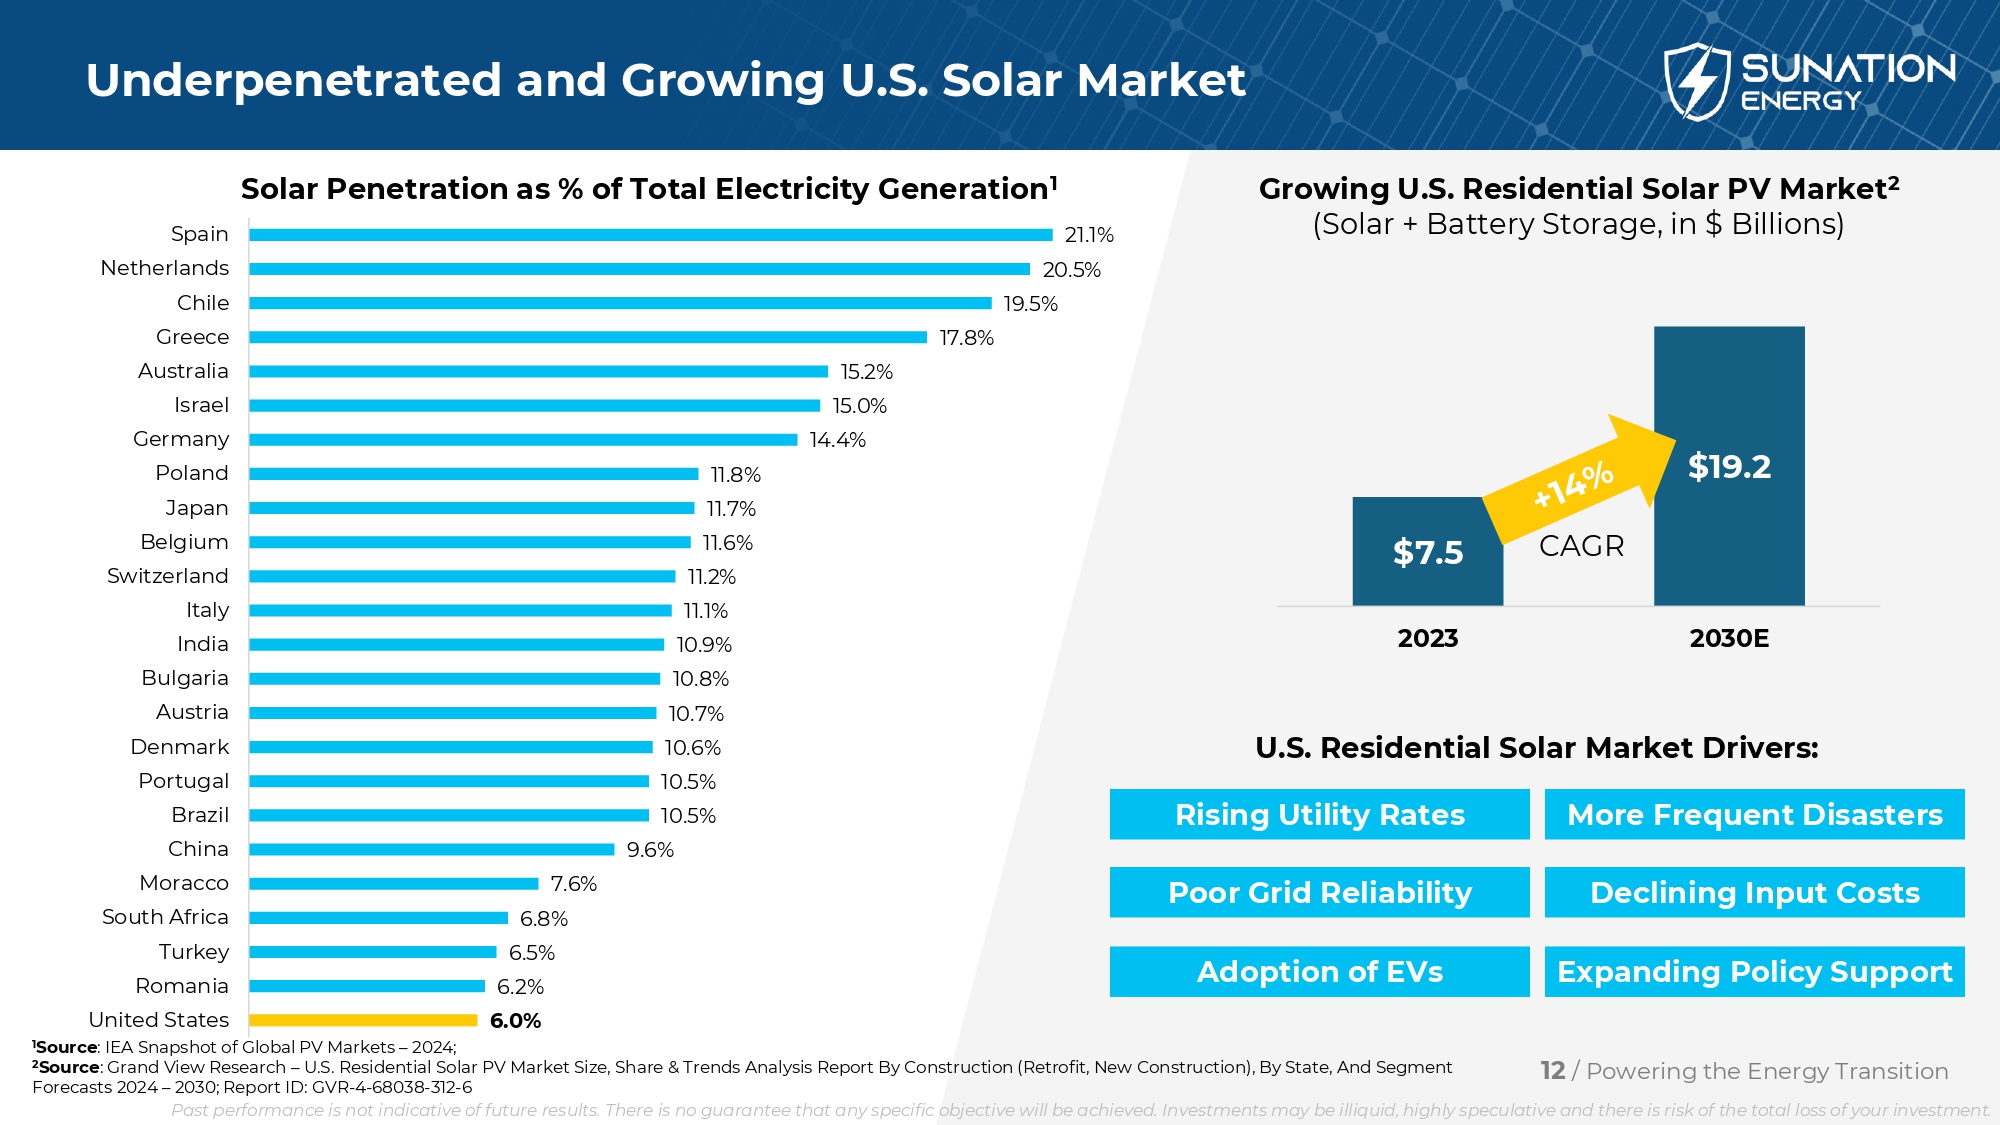
12 / Powering the Energy Transition Underpenetrated and Growing U.S. Solar Market 6.0% 6.2% 6.5% 6.8% 7.6% 9.6% 10.5% 10.5% 10.6% 10.7% 10.8% 10.9% 11.1% 11.2% 11.6% 11.7% 11.8% 14.4% 15.0% 15.2% 17.8% 19.5% 20.5% 21.1% United States Romania Turkey South Africa Moracco China Brazil Portugal Denmark Austria Bulgaria India Italy Switzerland Belgium Japan Poland Germany Israel Australia Greece Chile Netherlands Spain 1 Source : IEA Snapshot of Global PV Markets – 2024; 2 Source : Grand View Research – U.S. Residential Solar PV Market Size, Share & Trends Analysis Report By Construction (Retrofit, New Con struction), By State, And Segment Forecasts 2024 – 2030; Report ID: GVR - 4 - 68038 - 312 - 6 Solar Penetration as % of Total Electricity Generation 1 Growing U.S. Residential Solar PV Market 2 (Solar + Battery Storage, in $ Billions) $ 7.5 $ 19.2 2023 2030E U.S. Residential Solar Market Drivers: Rising Utility Rates Poor Grid Reliability Adoption of EVs More Frequent Disasters Declining Input Costs Expanding Policy Support CAGR Past performance is not indicative of future results. There is no guarantee that any specific objective will be achieved. Inv est ments may be illiquid, highly speculative and there is risk of the total loss of your investment.
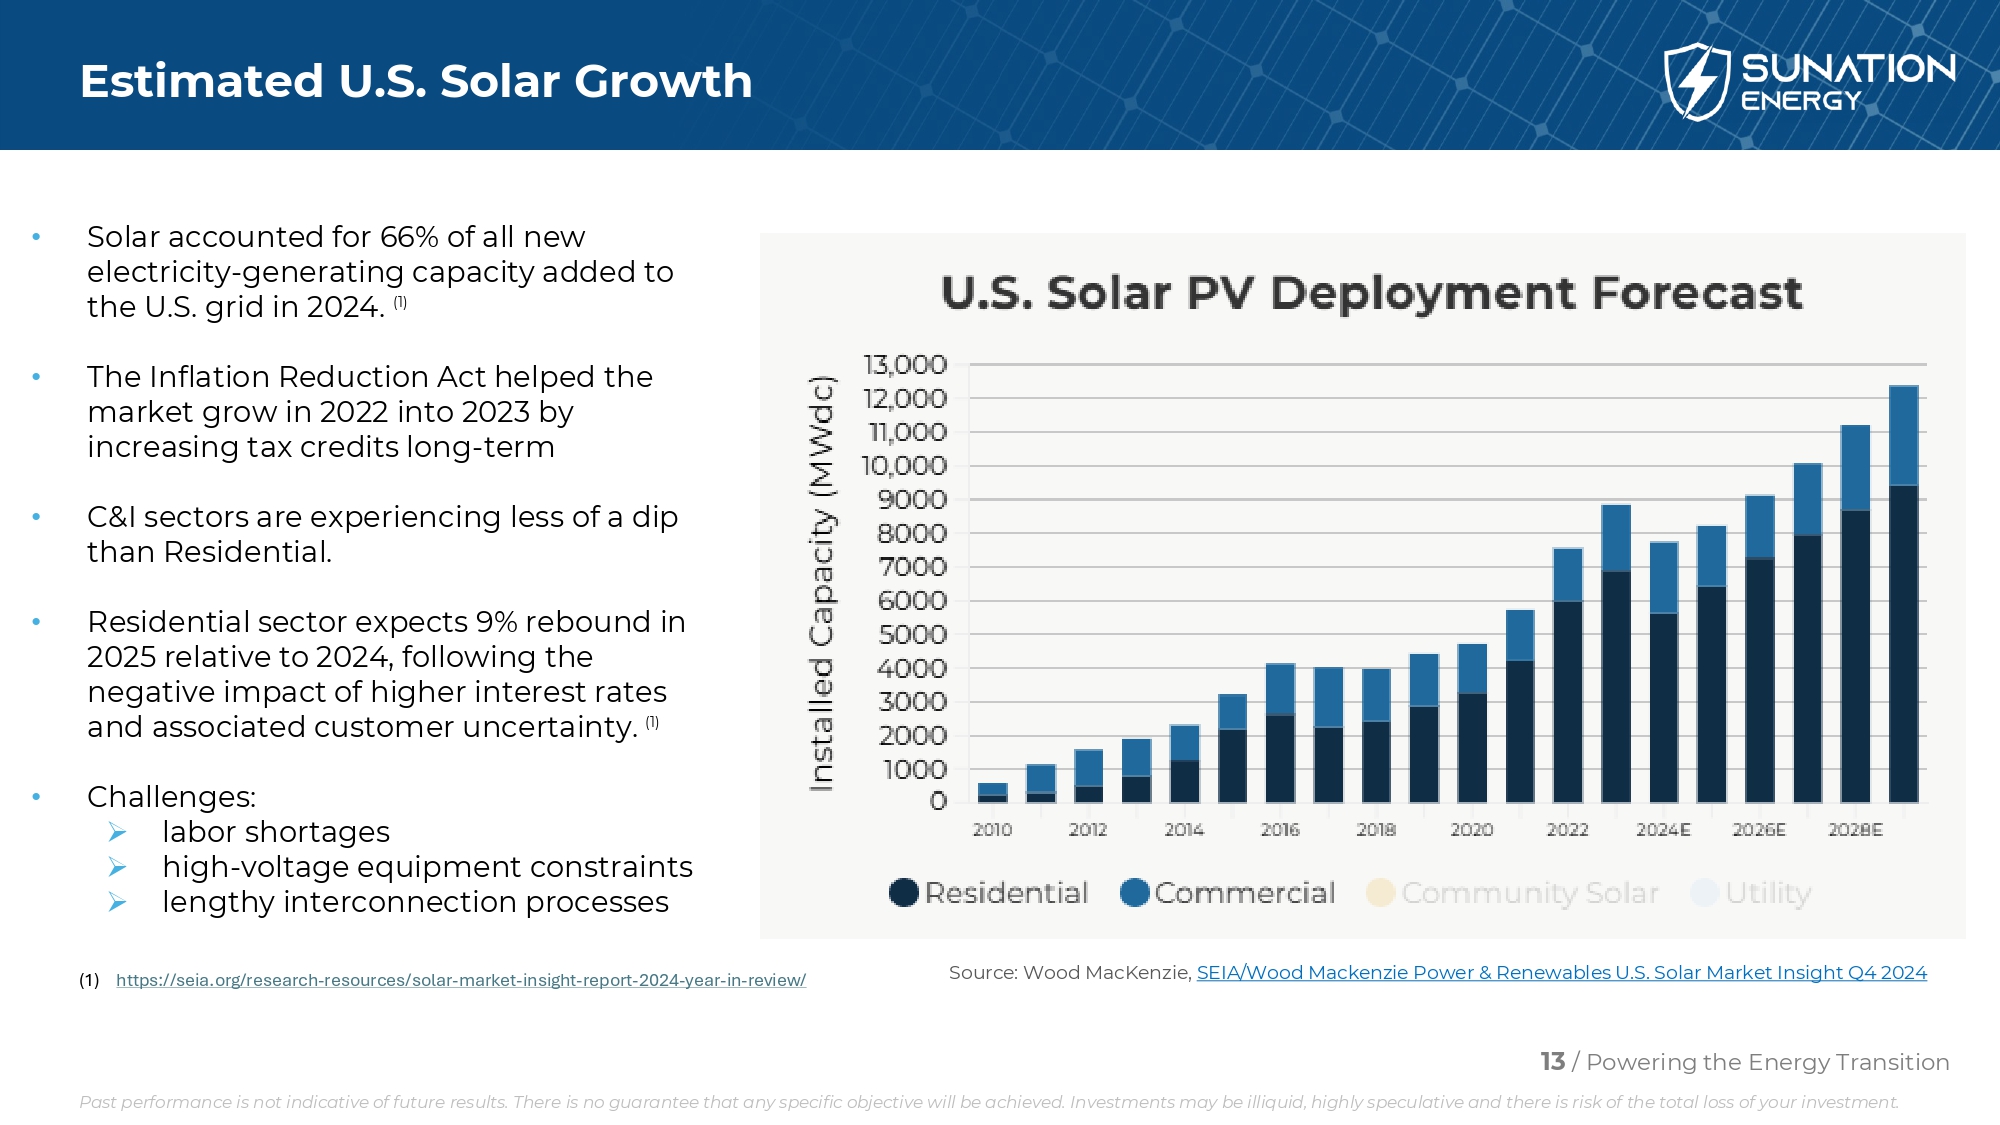
13 / Powering the Energy Transition Estimated U.S. Solar Growth • Solar accounted for 66% of all new electricity - generating capacity added to the U.S. grid in 2024. (1) • The Inflation Reduction Act helped the market grow in 2022 into 2023 by increasing tax credits long - term • C&I sectors are experiencing less of a dip than Residential. • Residential sector expects 9% rebound in 2025 relative to 2024, following the negative impact of higher interest rates and associated customer uncertainty. (1) • Challenges: » labor shortages » high - voltage equipment constraints » lengthy interconnection processes Source: Wood MacKenzie , SEIA/Wood Mackenzie Power & Renewables U.S. Solar Market Insight Q4 2024 (1) https://seia.org/research - resources/solar - market - insight - report - 2024 - year - in - review/ Past performance is not indicative of future results. There is no guarantee that any specific objective will be achieved. Inv est ments may be illiquid, highly speculative and there is risk of the total loss of your investment.
14 / Powering the Energy Transition Policy Support (Inflation Reduction Act) and Outlook Inflation Reduction Act Enacted in August 2022 • Extended 30% tax credit for installing residential solar until end of 2032 • Standalone battery storage sales eligible • Introduced new “adder” tax credits x 10% for projects using domestic hardware x 10% for projects in former energy communities x 10% for projects in LMI communities / on tribal land • Expanded Energy Efficient Home Improvement Credit up to $1200 for qualifying home improvement products The Inflation Reduction Act makes solar more accessible and will accelerate adoption over the next decade. Solar Industry Outlook • U.S. solar industry grew by 128% under President Trump’s first term, reaching 100 gigawatts (GW) of total installed capacity, enough to power 17 M homes 1 • This period of growth set the U.S. on a trajectory to becoming the #2 solar market in the world, with 220 GW on the grid and 100+ solar and storage manufacturing plants across 43 states 1 • Solar creates good paying jobs and generates substantial revenue at the regional level , positioning SUNE and the industry as a significant contributor to the national energy mix • SUNE’s distributed energy solutions fortify local energy infrastructures, making a solar a vital part of national energy security • Solar adoption typically rises in a lower interest rate environment 1 SEAI: https://seia.org/news/solar - and - storage - industry - pushes - policy - agenda - for - trump - administration - new - congress - to - strengthen - americ an - energy - leadership/ Past performance is not indicative of future results. There is no guarantee that any specific objective will be achieved. Inv est ments may be illiquid, highly speculative and there is risk of the total loss of your investment.
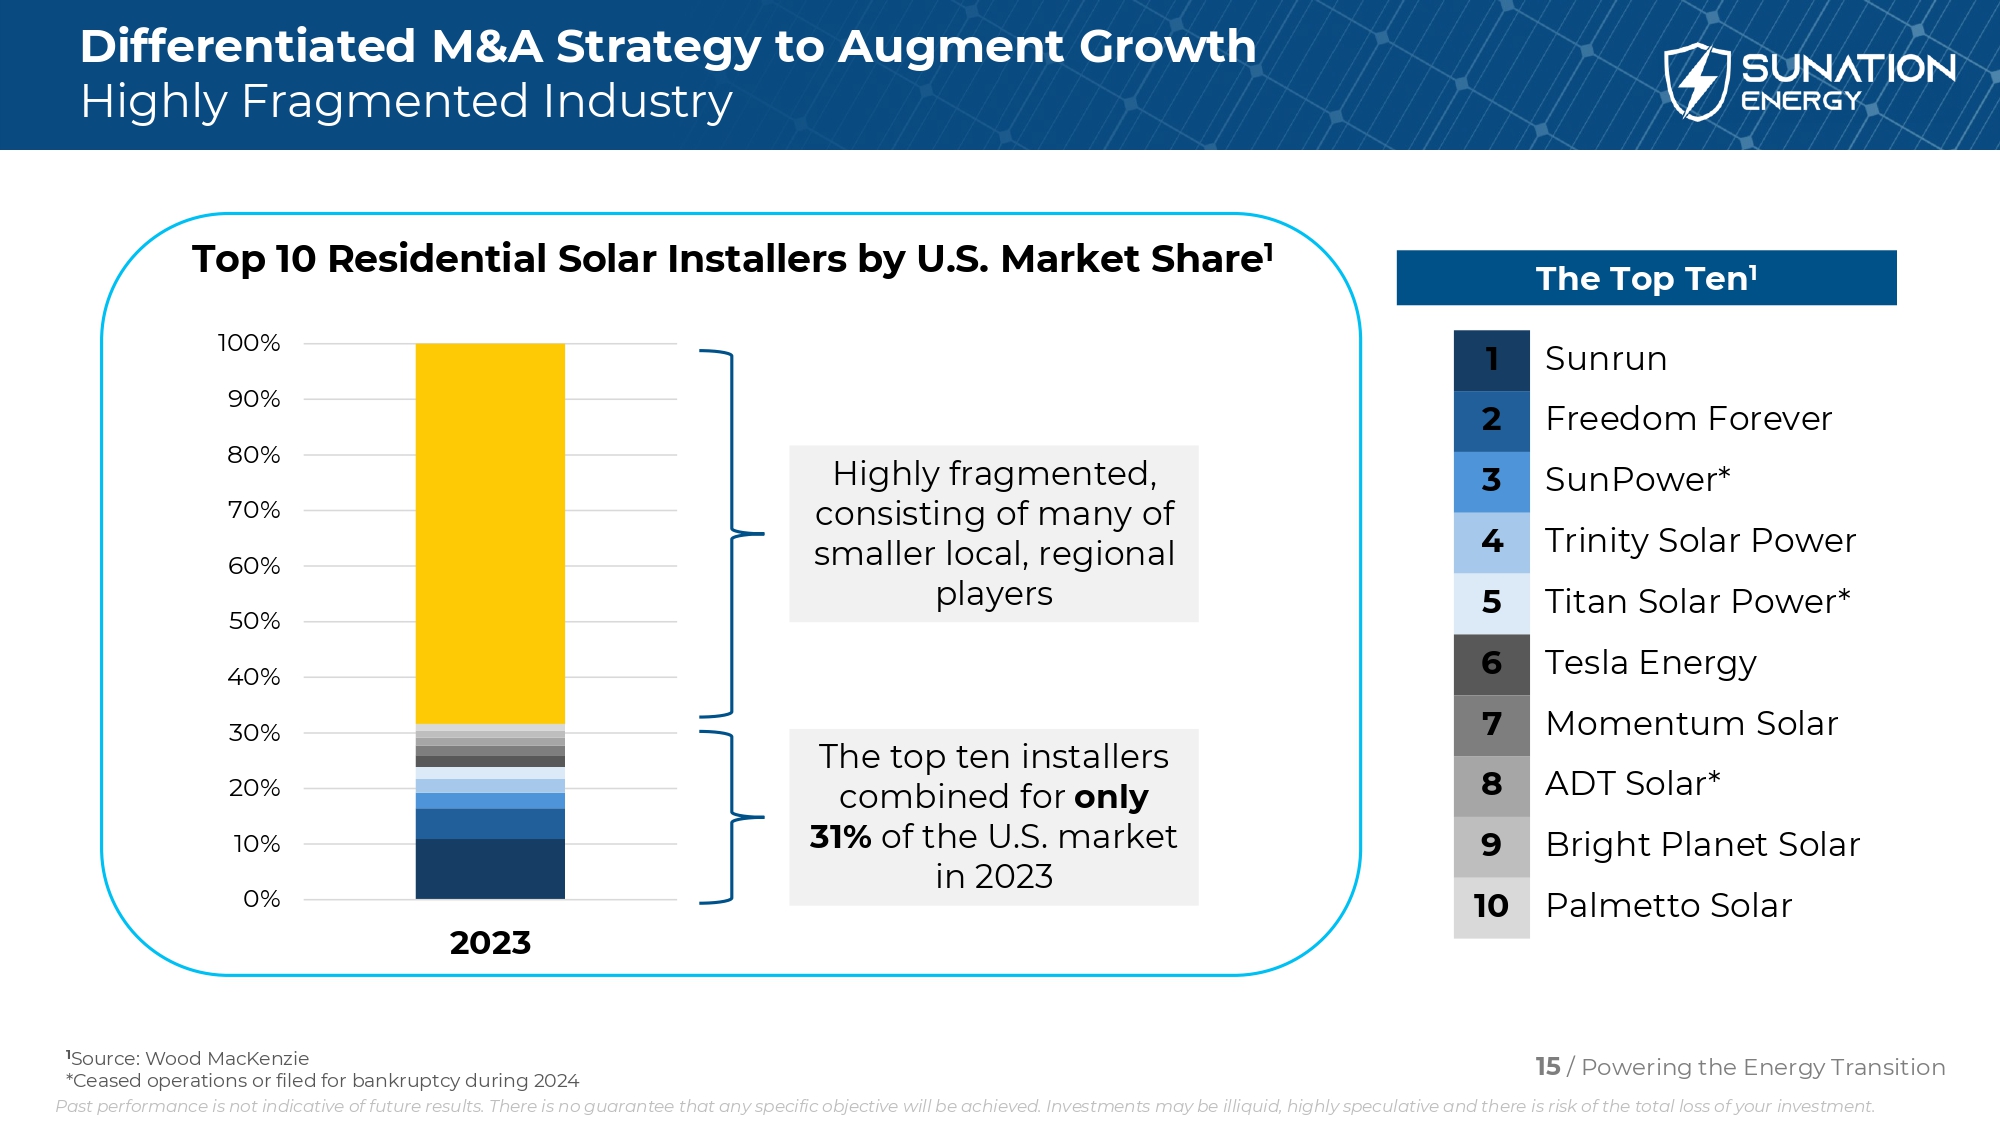
15 / Powering the Energy Transition Differentiated M&A Strategy to Augment Growth Highly Fragmented Industry Top 10 Residential Solar Installers by U.S. Market Share 1 The top ten installers combined for only 31% of the U.S. market in 2023 1 Source: Wood MacKenzie *Ceased operations or filed for bankruptcy during 2024 0% 10% 20% 30% 40% 50% 60% 70% 80% 90% 100% 2023 Highly fragmented, consisting of many of smaller local, regional players The Top Ten 1 Sunrun 1 Freedom Forever 2 SunPower* 3 Trinity Solar Power 4 Titan Solar Power* 5 Tesla Energy 6 Momentum Solar 7 ADT Solar* 8 Bright Planet Solar 9 Palmetto Solar 10 Past performance is not indicative of future results. There is no guarantee that any specific objective will be achieved. Inv est ments may be illiquid, highly speculative and there is risk of the total loss of your investment.
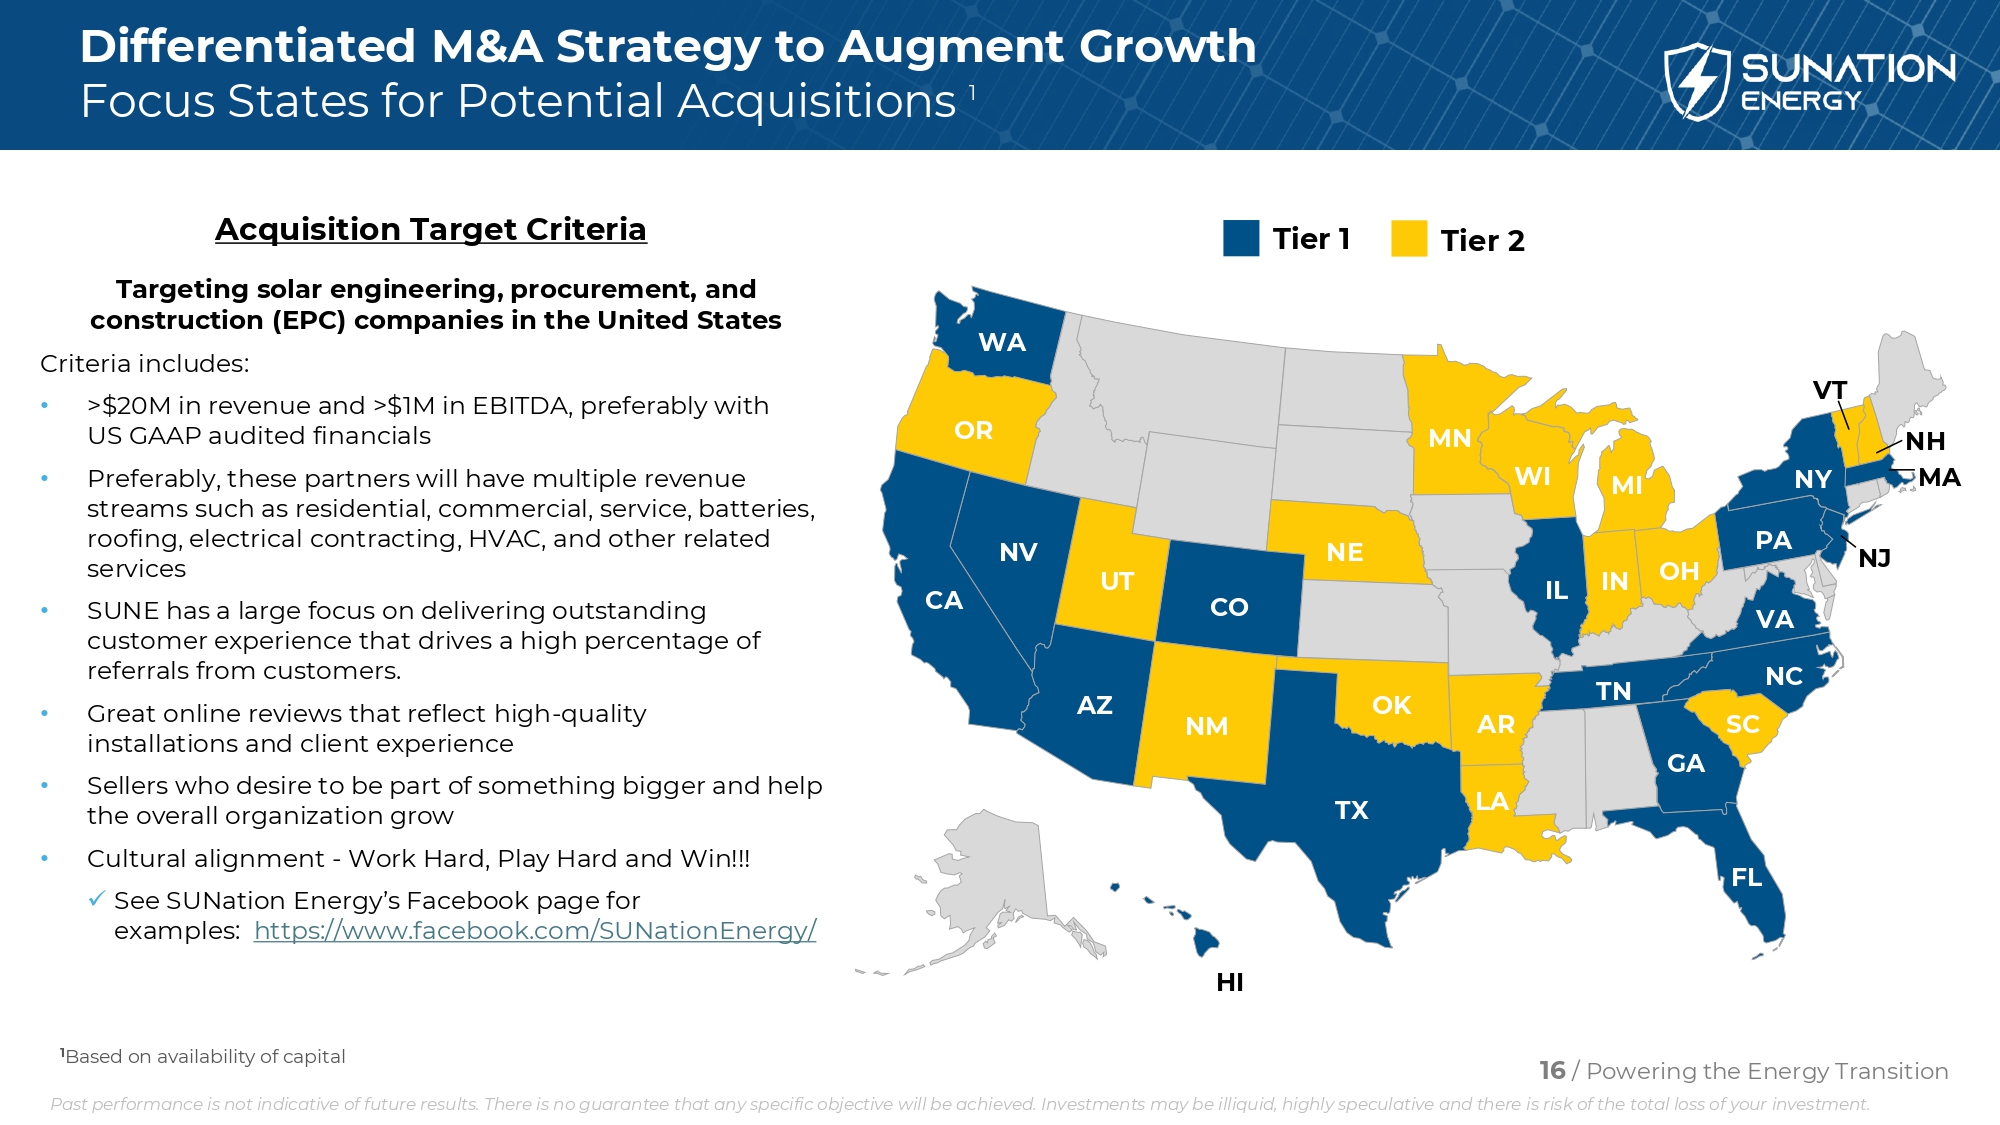
16 / Powering the Energy Transition Differentiated M&A Strategy to Augment Growth Focus States for Potential Acquisitions 1 Tier 1 Tier 2 Acquisition Target Criteria Targeting solar engineering, procurement, and construction (EPC) companies in the United States Criteria includes: • >$20M in revenue and >$1M in EBITDA, p referably with US GAAP audited financials • Preferably, these partners will have multiple revenue streams such as residential, commercial, service, batteries, roofing, electrical contracting, HVAC, and other related services • SUNE has a large focus on delivering outstanding customer experience that drives a high percentage of referrals from customers. • Great online reviews that reflect h igh - quality installations and client experience • Sellers who desire to be part of something bigger and help the overall organization grow • Cultural alignment - Work Hard, Play Hard and Win!!! x See SUNation Energy’s Facebook page for examples: https://www.facebook.com/SUNationEnergy/ WA OR CA NV UT AZ CO NE MN WI MI OK TX NM HI LA AR IL IN OH PA NY TN GA FL SC NC VA VT NH MA NJ 1 Based on availability of capital Past performance is not indicative of future results. There is no guarantee that any specific objective will be achieved. Inv est ments may be illiquid, highly speculative and there is risk of the total loss of your investment.
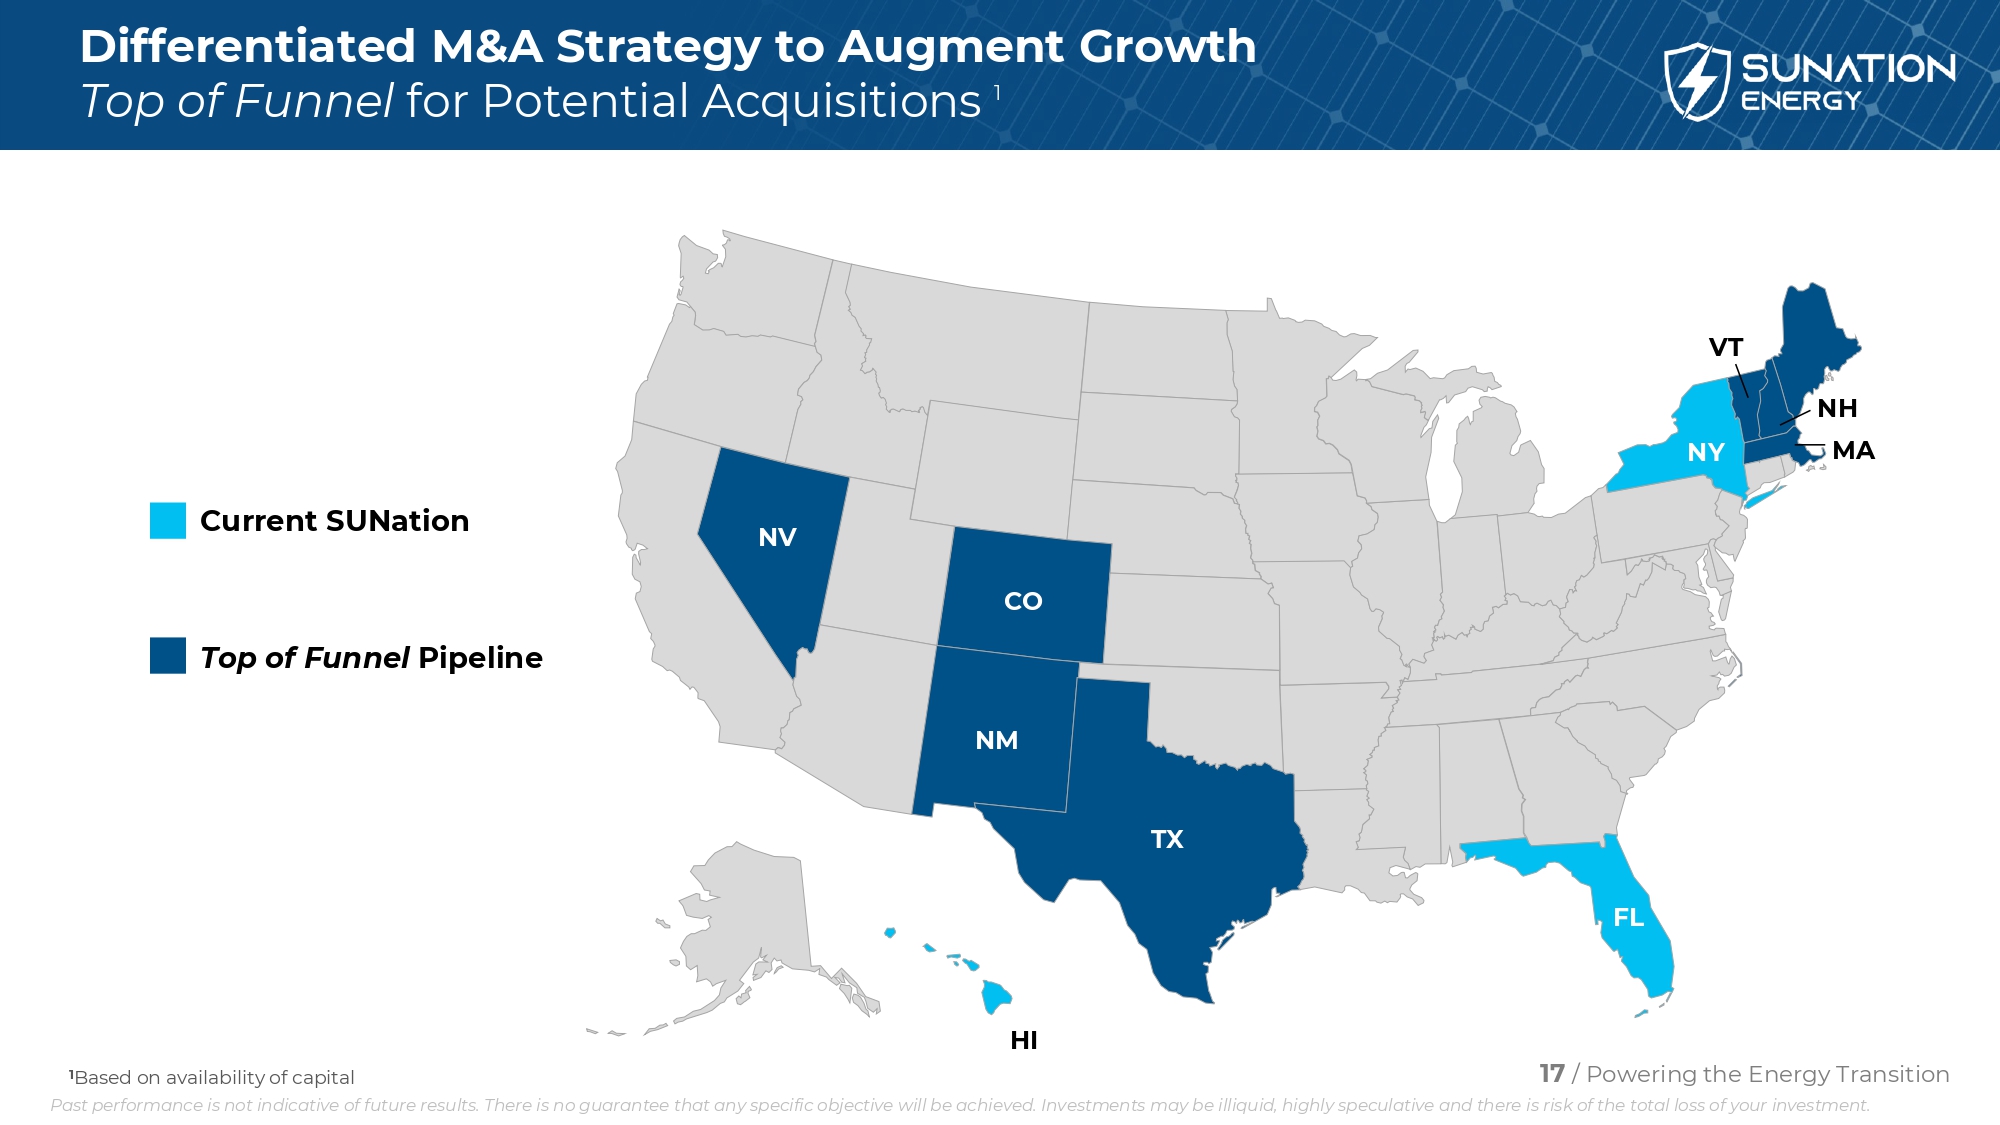
NV CO TX NM HI NY FL VT NH MA 17 / Powering the Energy Transition Differentiated M&A Strategy to Augment Growth Top of Funnel for Potential Acquisitions 1 Current SUNation Top of Funnel Pipeline ME 1 Based on availability of capital Past performance is not indicative of future results. There is no guarantee that any specific objective will be achieved. Inv est ments may be illiquid, highly speculative and there is risk of the total loss of your investment.
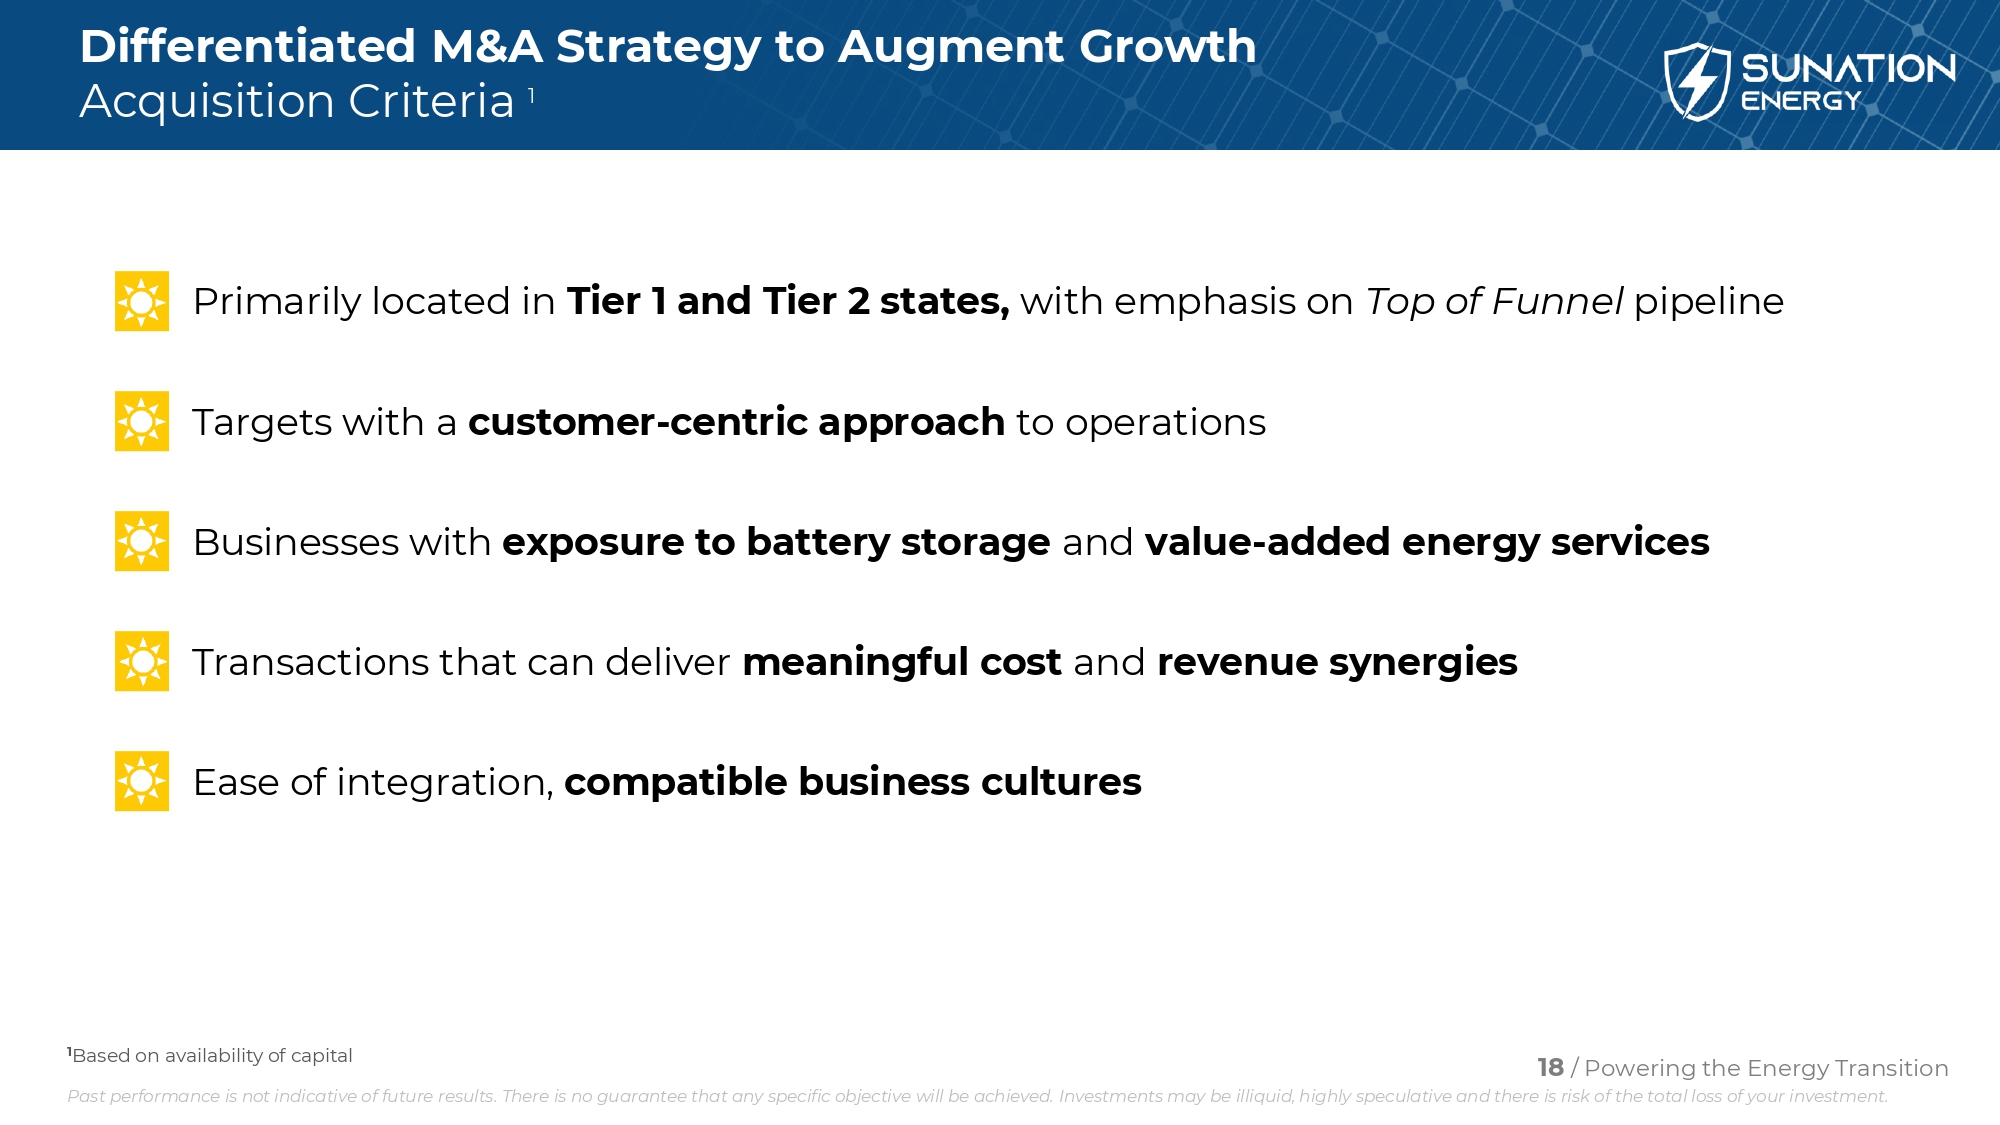
18 / Powering the Energy Transition Differentiated M&A Strategy to Augment Growth Acquisition Criteria 1 Primarily located in Tier 1 and Tier 2 states, with emphasis on Top of Funnel pipeline Targets with a customer - centric approach to operations Businesses with exposure to battery storage and value - added energy services Transactions that can deliver meaningful cost and revenue synergies Ease of integration, compatible business cultures 1 Based on availability of capital Past performance is not indicative of future results. There is no guarantee that any specific objective will be achieved. Inv est ments may be illiquid, highly speculative and there is risk of the total loss of your investment.
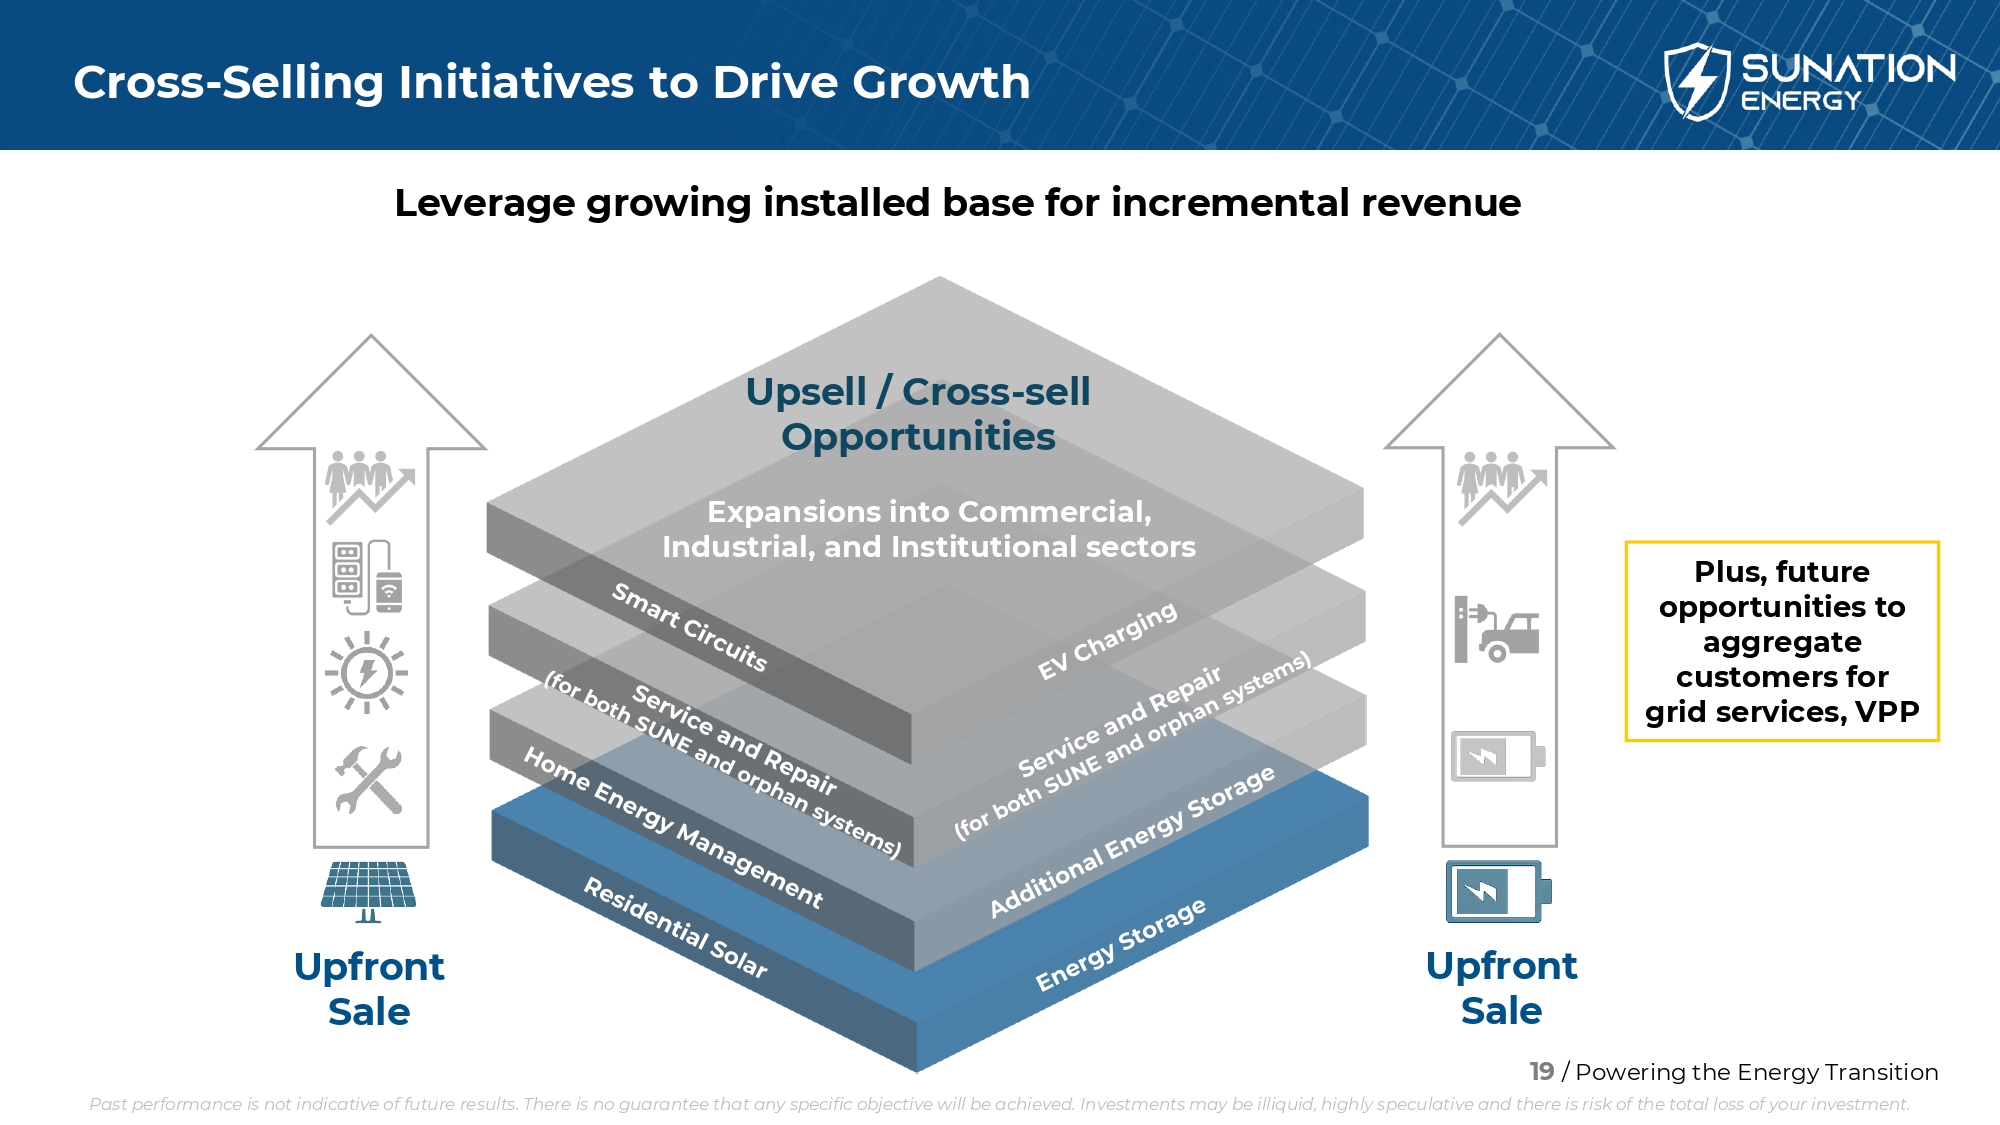
19 / Powering the Energy Transition Cross - Selling Initiatives to Drive Growth Upfront Sale Upfront Sale Upsell / Cross - sell Opportunities Leverage growing installed base for incremental revenue Plus, future opportunities to aggregate customers for grid services, VPP Expansions into Commercial, Industrial, and Institutional sectors Past performance is not indicative of future results. There is no guarantee that any specific objective will be achieved. Inv est ments may be illiquid, highly speculative and there is risk of the total loss of your investment.
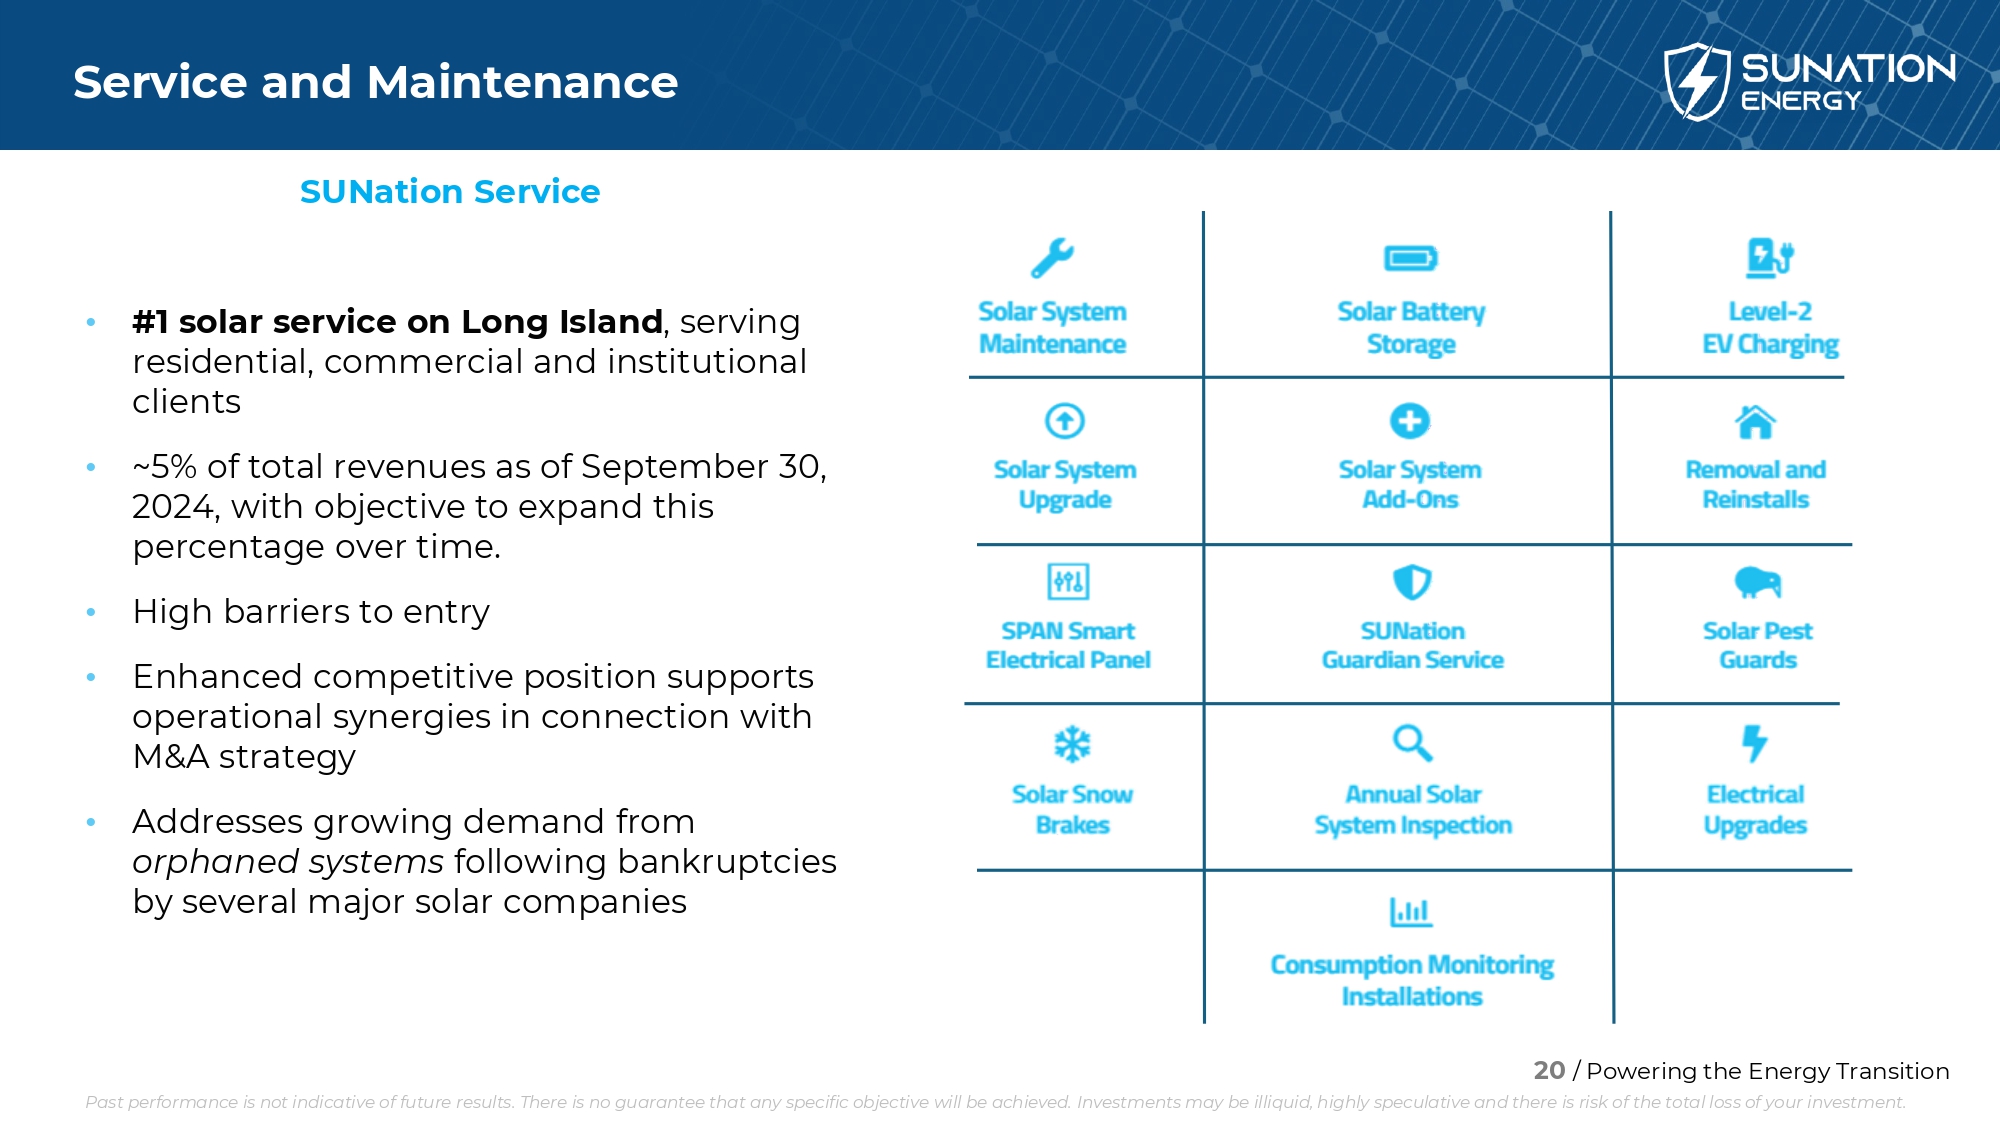
20 / Powering the Energy Transition Service and Maintenance • #1 solar service on Long Island , s erving residential, commercial and institutional clients • ~5% of total revenues as of September 30, 2024, with objective to expand this percentage over time. • High barriers to entry • Enhanced competitive position supports operational synergies in connection with M&A strategy • Addresses growing demand from orphaned systems following bankruptcies by several major solar companies SUNation Service Past performance is not indicative of future results. There is no guarantee that any specific objective will be achieved. Inv est ments may be illiquid, highly speculative and there is risk of the total loss of your investment.

21 / Powering the Energy Transition Investment Conclusions • Refreshed leadership charting a new course for a well - respected, 20+ year old company • Strategic restructuring largely completed, marking a turning point in SUNation’s growth and development • Continued focus on growing revenues, lower operating expenses, and improved balance sheet • Well - positioned to address expected resurgence in solar energy industry, beginning in 2025 • Deliberate and measured acquisition strategy to complement organic growth initiatives and take advantage of compelling opportunities in the solar industry Our 2025 Outlook • Increased commercial and industrial solar project activity. • Continuance of solar incentives under Trump Administration • Stronger outlook for consumer lending rates due to potential for Federal Reserve actions Past performance is not indicative of future results. There is no guarantee that any specific objective will be achieved. Inv est ments may be illiquid, highly speculative and there is risk of the total loss of your investment.
22 / Powering the Energy Transition Forward Looking Statements | Financials / Appendix |
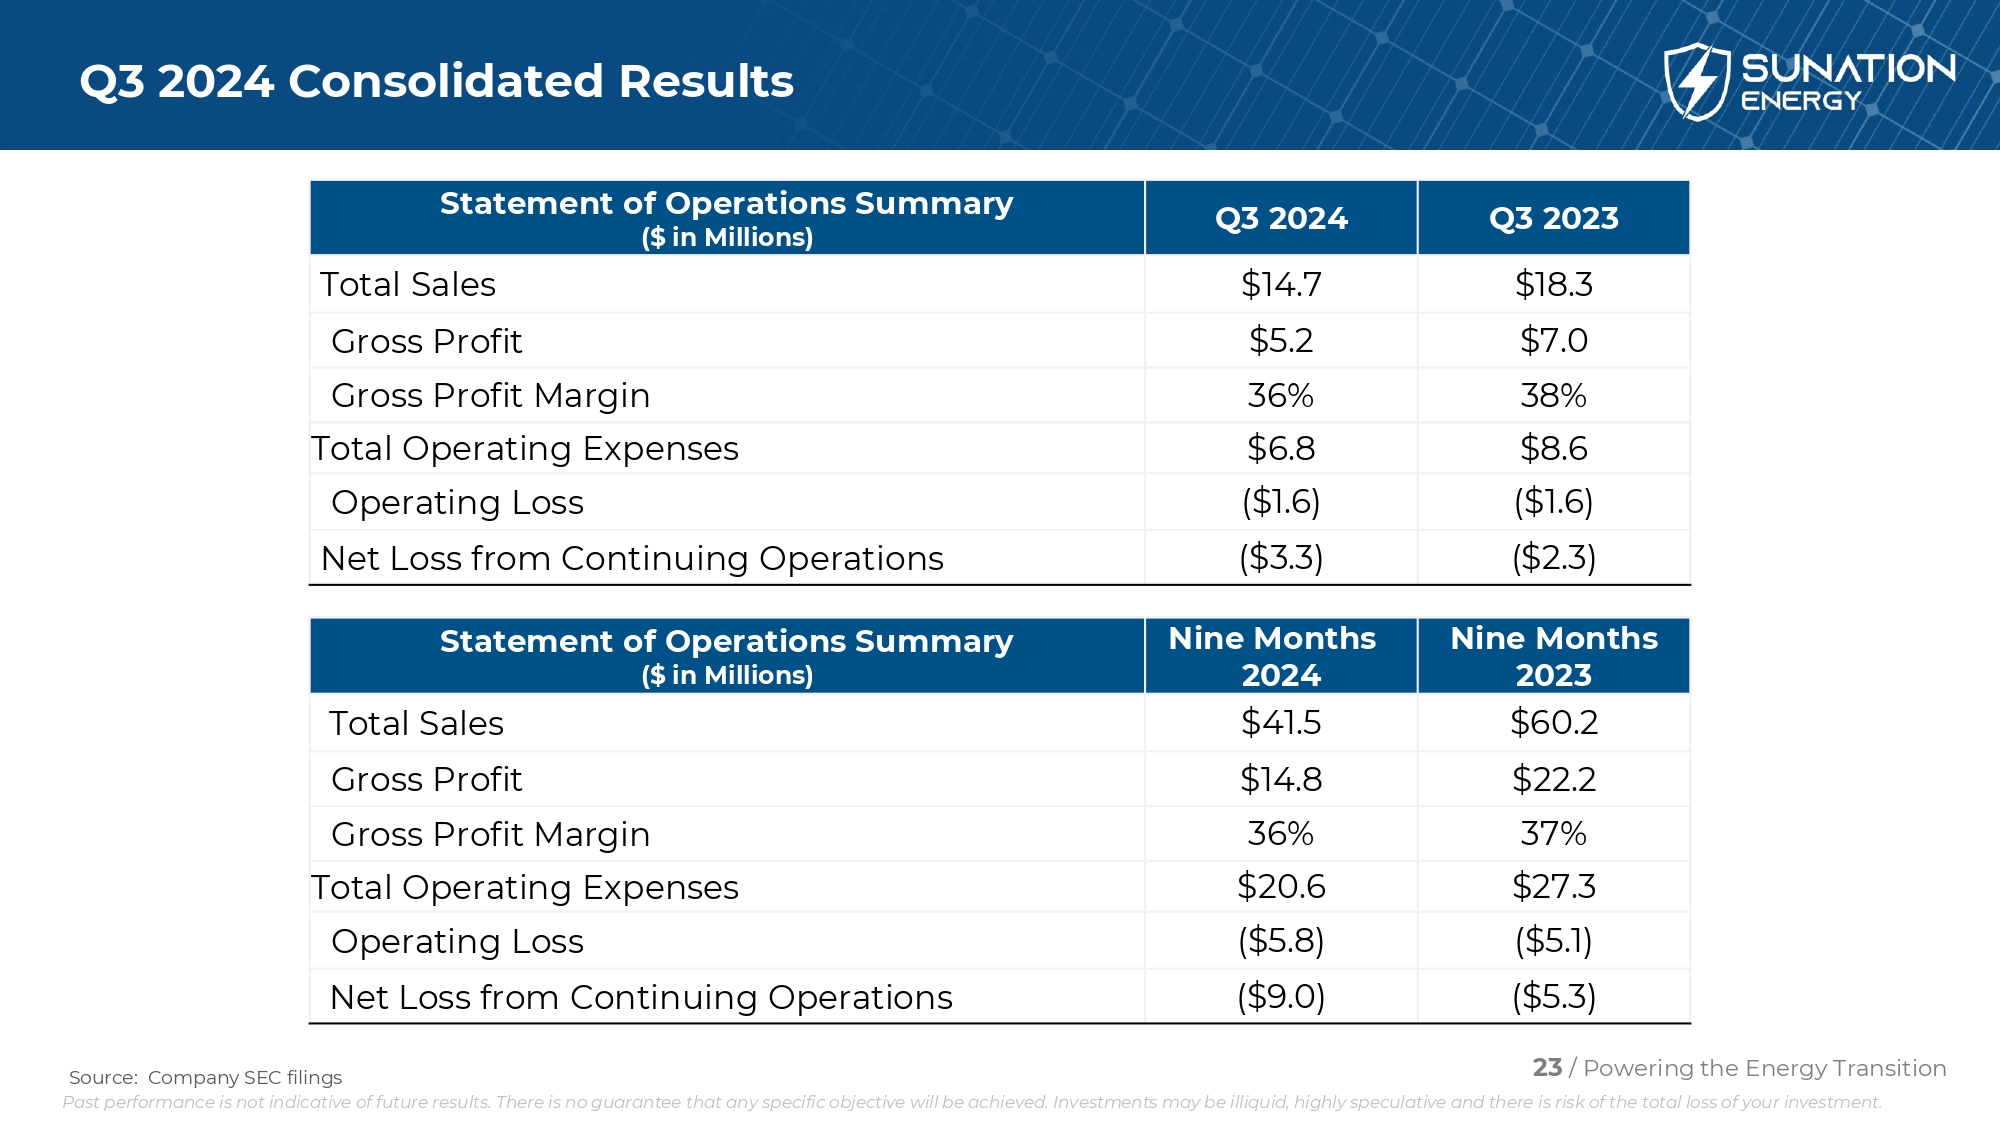
23 / Powering the Energy Transition Q3 2024 Consolidated Results Q3 2023 Q3 2024 Statement of Operations Summary ($ in Millions) $18.3 $14.7 Total Sales $7.0 $5.2 Gross Profit 38% 36% Gross Profit Margin $8.6 $6.8 Total Operating Expenses ($1.6) ($1.6) Operating Loss ($2.3) ($3.3) Net Loss from Continuing Operations Nine Months 2023 Nine Months 2024 Statement of Operations Summary ($ in Millions) $60.2 $41.5 Total Sales $22.2 $14.8 Gross Profit 37% 36% Gross Profit Margin $27.3 $20.6 Total Operating Expenses ($5.1) ($5.8) Operating Loss ($5.3) ($9.0) Net Loss from Continuing Operations Source: Company SEC filings Past performance is not indicative of future results. There is no guarantee that any specific objective will be achieved. Inv est ments may be illiquid, highly speculative and there is risk of the total loss of your investment. KH0
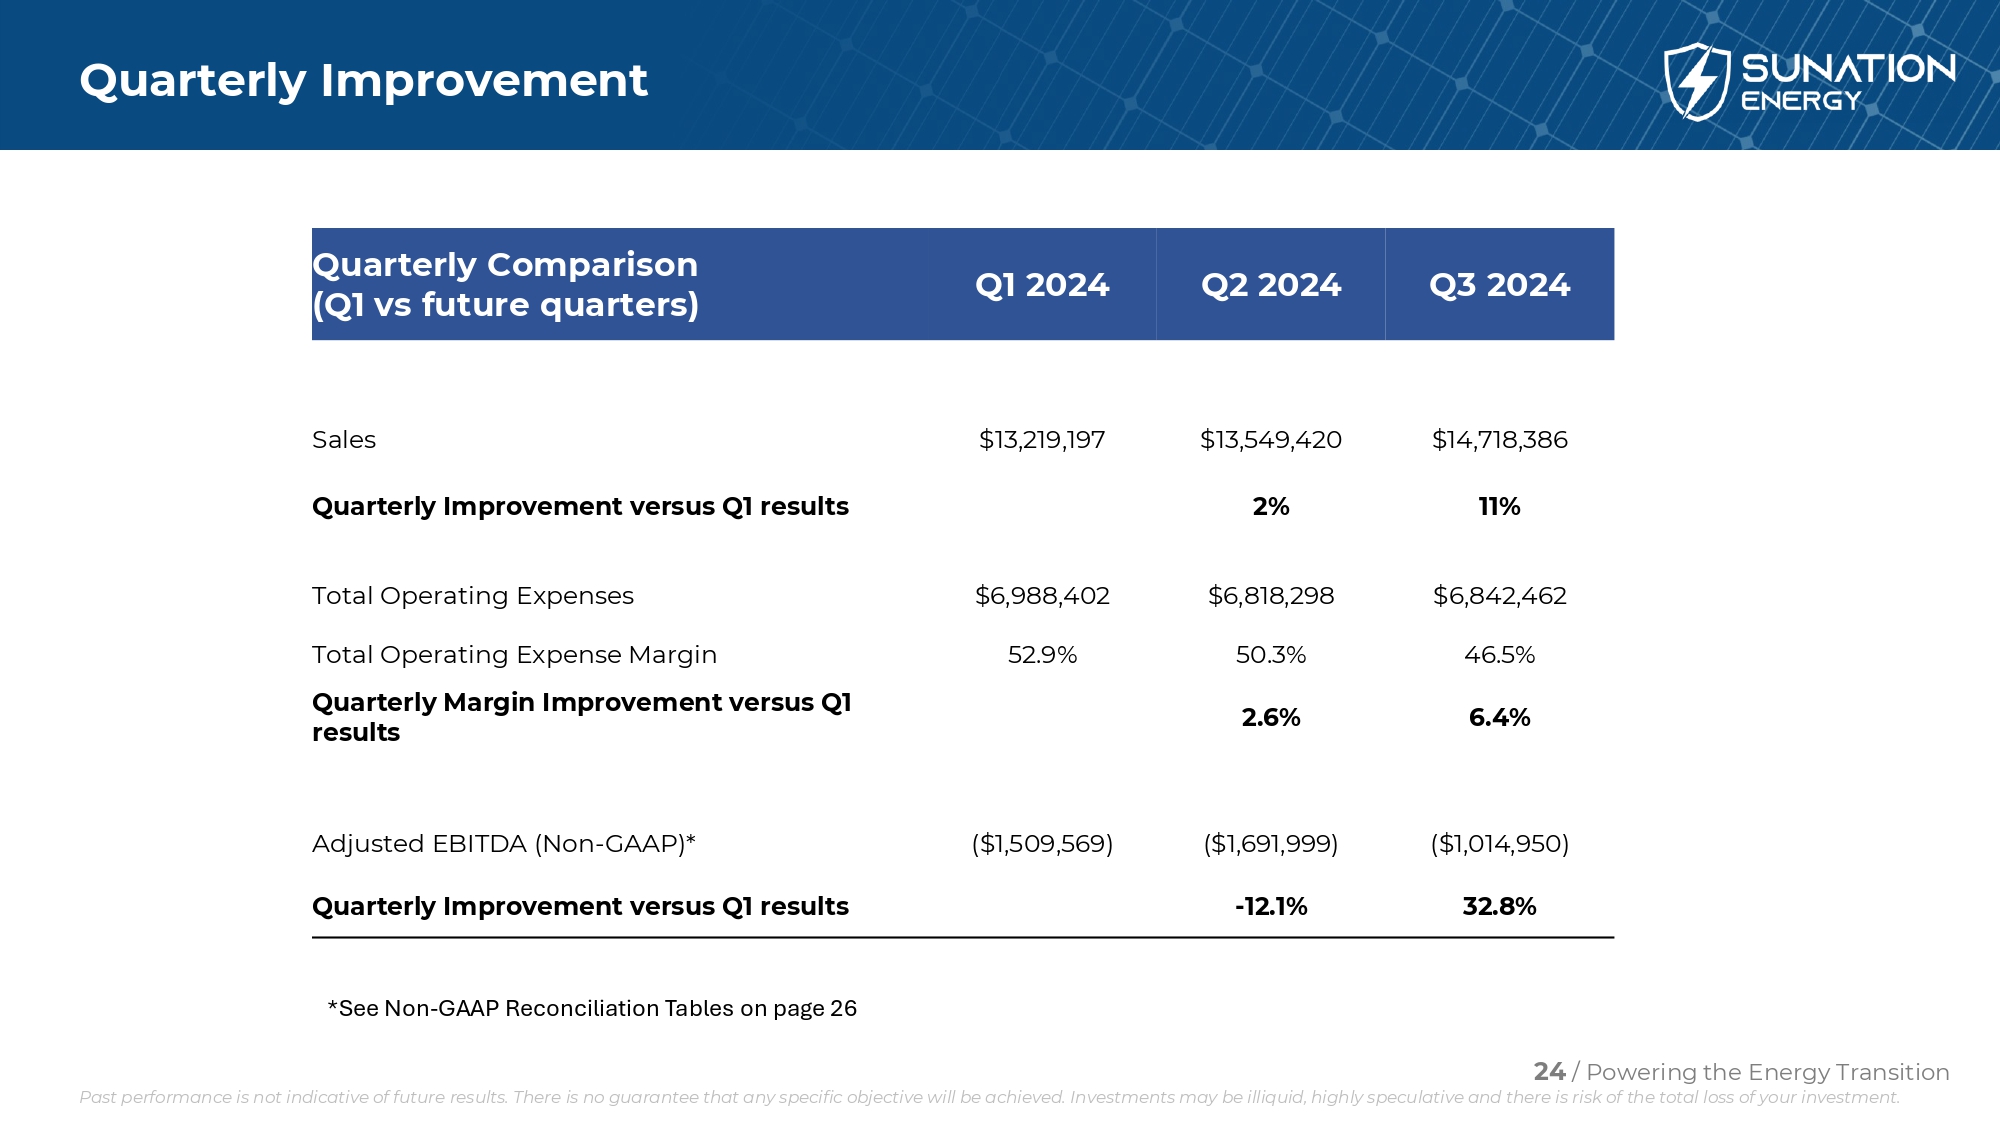
Quarterly Improvement Q3 2024 Q2 2024 Q1 2024 Quarterly Comparison (Q1 vs future quarters) $14,718,386 $13,549,420 $13,219,197 Sales 11% 2% Quarterly Improvement versus Q1 results $6,842,462 $6,818,298 $6,988,402 Total Operating Expenses 46.5% 50.3% 52.9% Total Operating Expense Margin 6.4% 2.6% Quarterly Margin Improvement versus Q1 results ($1,014,950) ($1,691,999) ($1,509,569) Adjusted EBITDA (Non - GAAP)* 32.8% - 12.1% Quarterly Improvement versus Q1 results 24 / Powering the Energy Transition *See Non - GAAP Reconciliation Tables on page 26 Past performance is not indicative of future results. There is no guarantee that any specific objective will be achieved. Inv est ments may be illiquid, highly speculative and there is risk of the total loss of your investment.
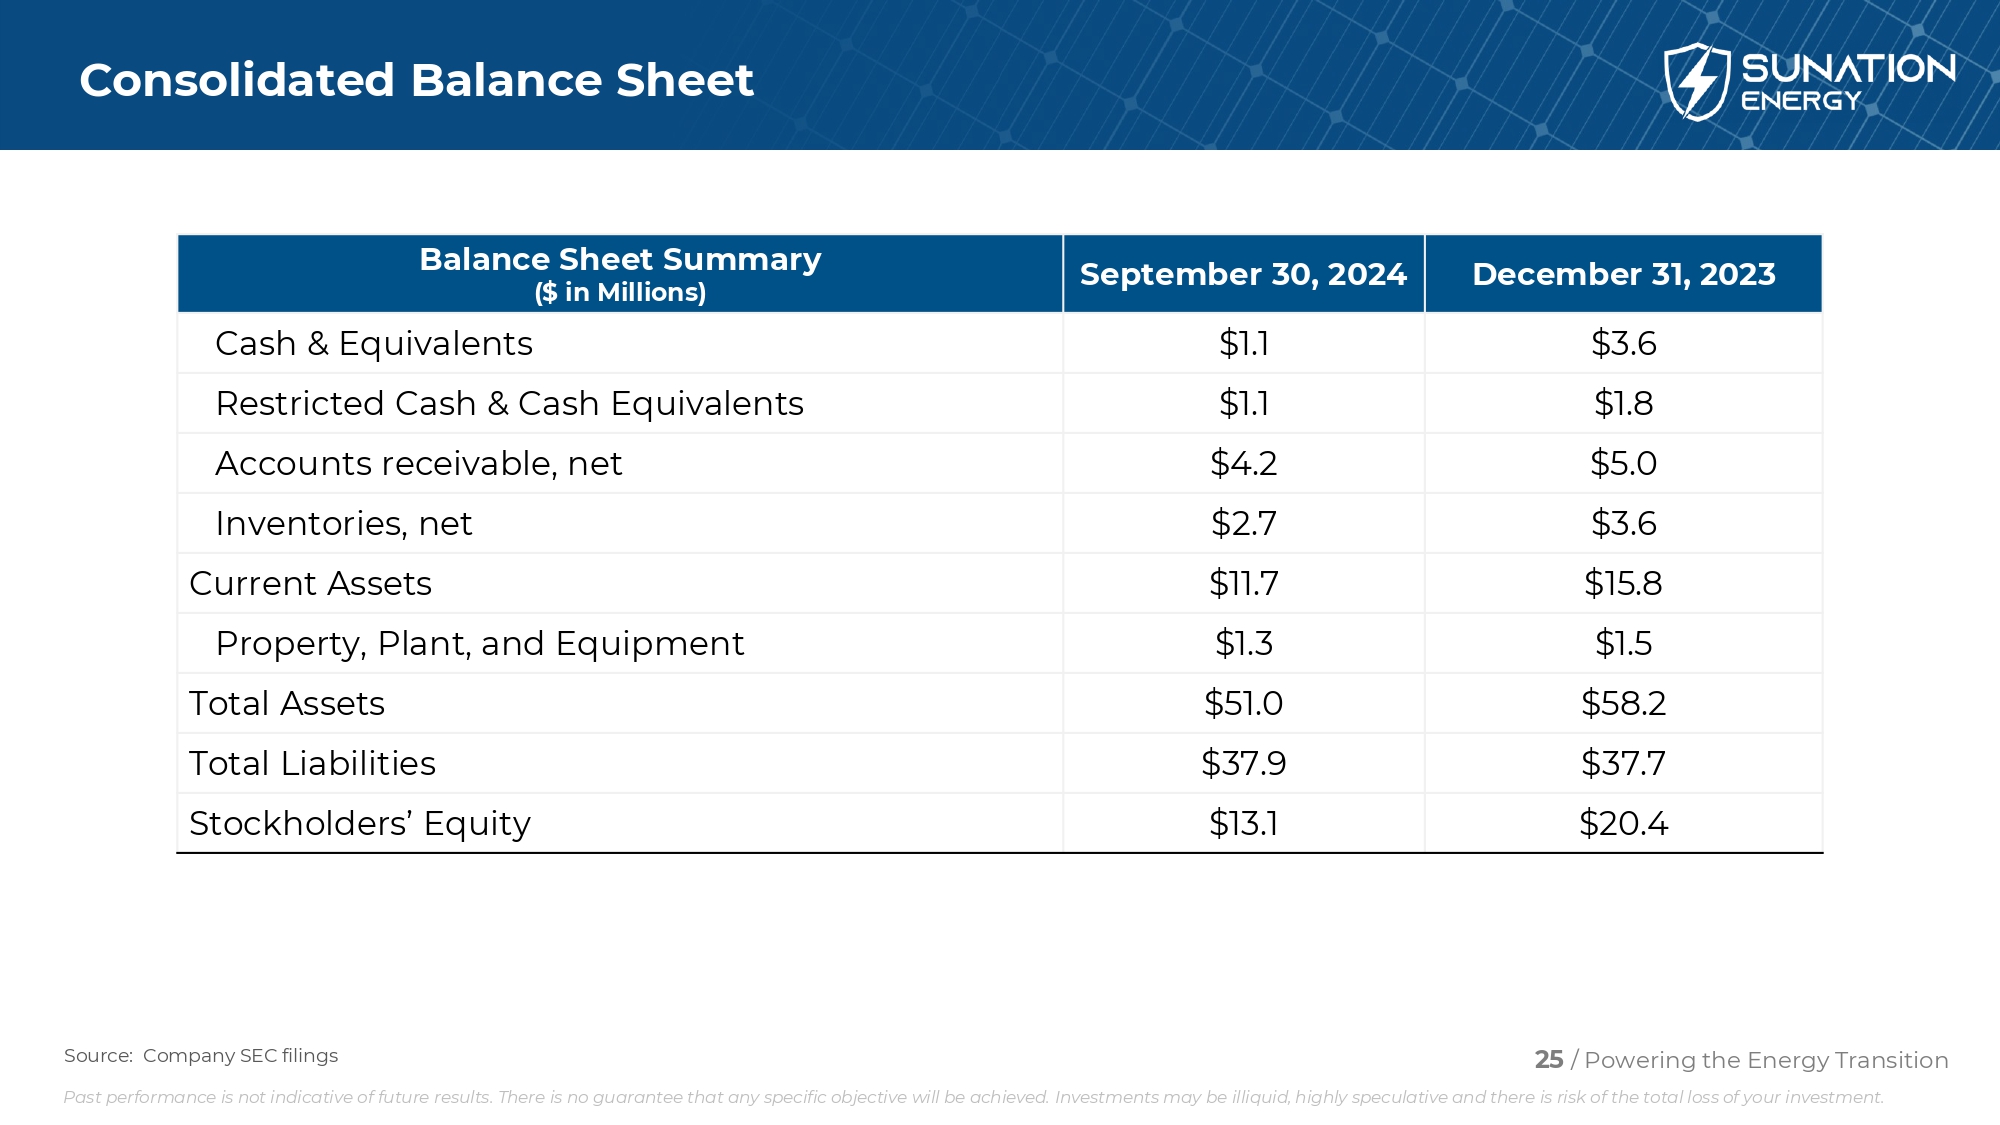
Consolidated Balance Sheet December 31, 2023 September 30, 2024 Balance Sheet Summary ($ in Millions) $3.6 $1.1 Cash & Equivalents $1.8 $1.1 Restricted Cash & Cash Equivalents $5.0 $4.2 Accounts receivable, net $3.6 $2.7 Inventories, net $15.8 $11.7 Current Assets $1.5 $1.3 Property, Plant, and Equipment $58.2 $51.0 Total Assets $37.7 $37.9 Total Liabilities $20.4 $13.1 Stockholders’ Equity 25 / Powering the Energy Transition Source: Company SEC filings Past performance is not indicative of future results. There is no guarantee that any specific objective will be achieved. Inv est ments may be illiquid, highly speculative and there is risk of the total loss of your investment.
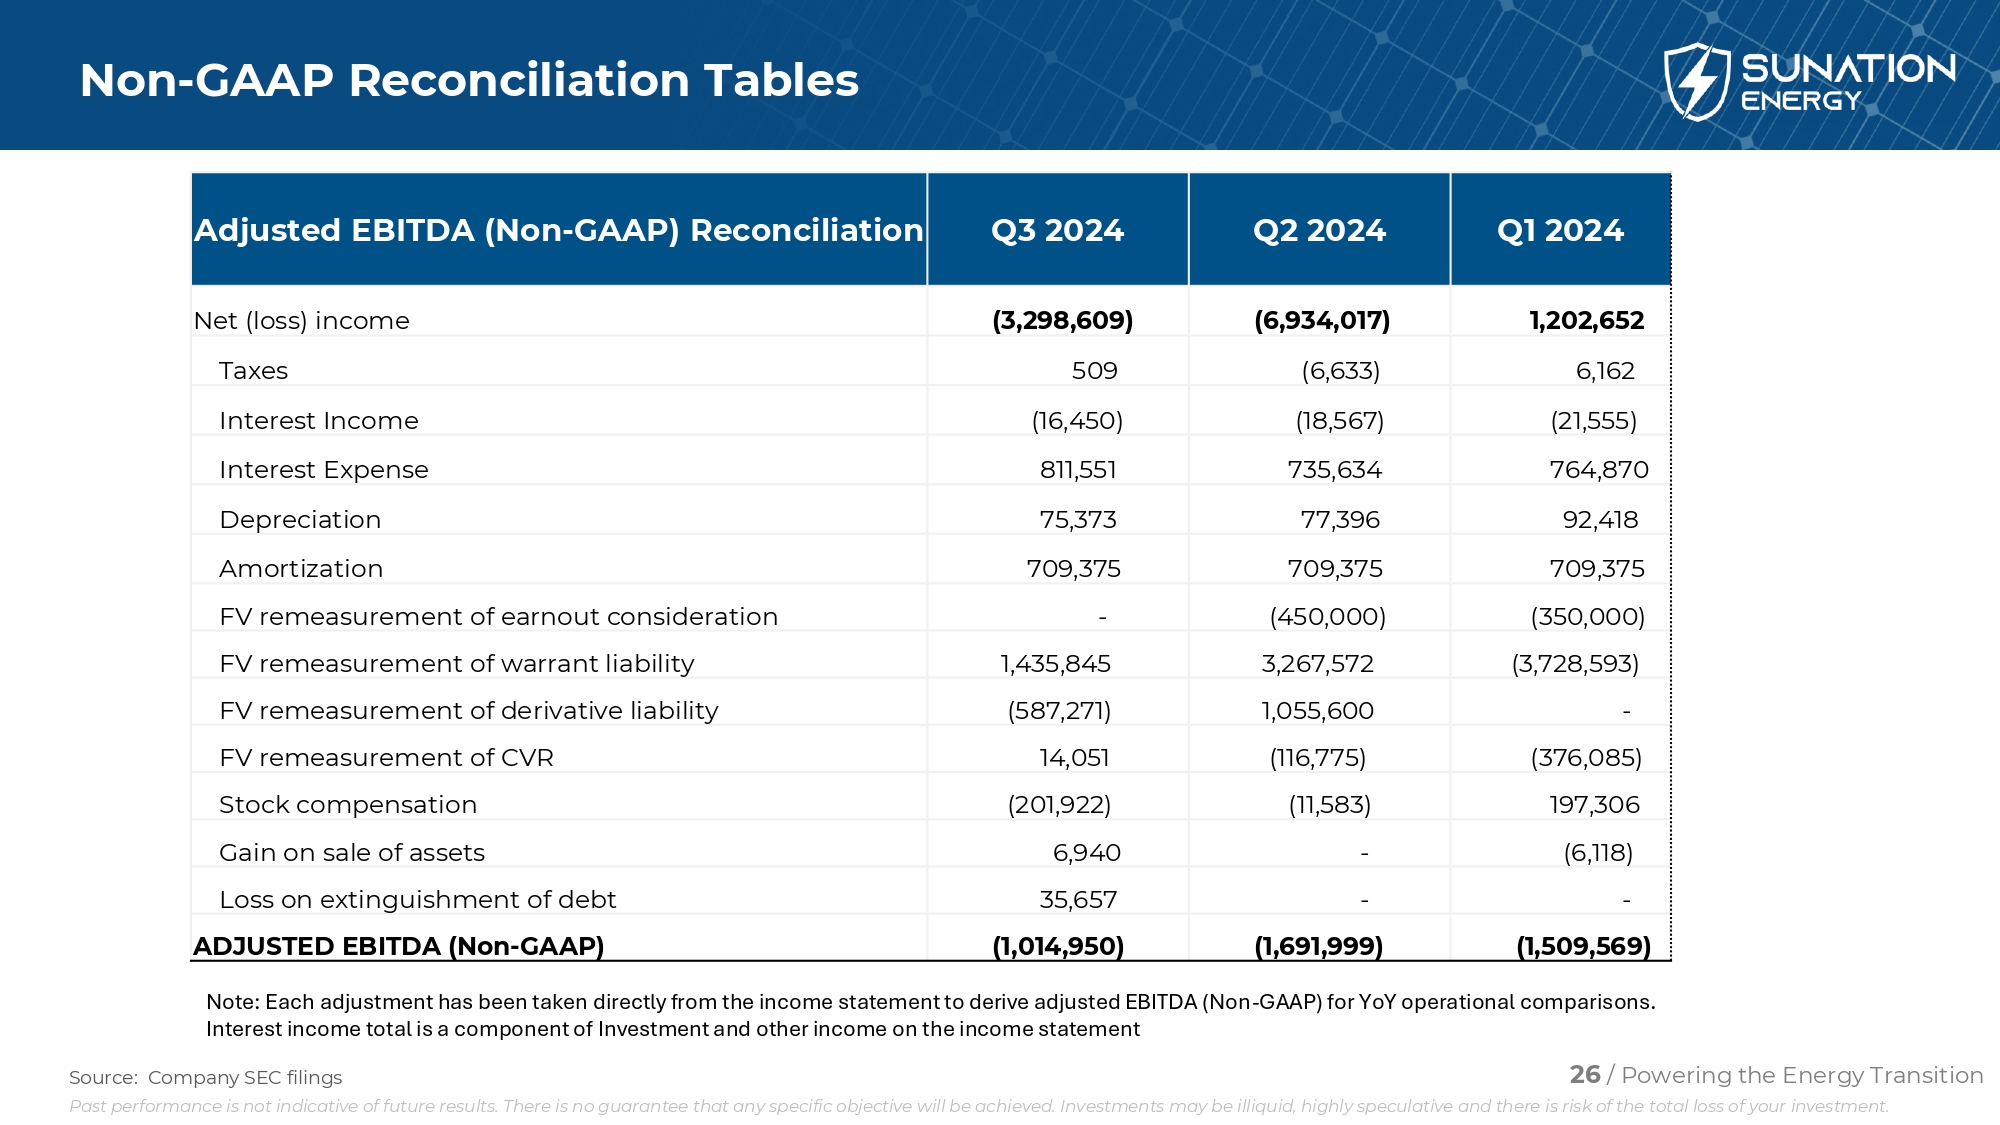
Non - GAAP Reconciliation Tables 26 / Powering the Energy Transition Source: Company SEC filings Q1 2024 Q2 2024 Q3 2024 Adjusted EBITDA (Non - GAAP) Reconciliation 1,202,652 (6,934,017) (3,298,609) Net (loss) income 6,162 (6,633) 509 Taxes (21,555) (18,567) (16,450) Interest Income 764,870 735,634 811,551 Interest Expense 92,418 77,396 75,373 Depreciation 709,375 709,375 709,375 Amortization (350,000) (450,000) - FV remeasurement of earnout consideration (3,728,593) 3,267,572 1,435,845 FV remeasurement of warrant liability - 1,055,600 (587,271) FV remeasurement of derivative liability (376,085) (116,775) 14,051 FV remeasurement of CVR 197,306 (11,583) (201,922) Stock compensation (6,118) - 6,940 Gain on sale of assets - - 35,657 Loss on extinguishment of debt (1,509,569) (1,691,999) (1,014,950) ADJUSTED EBITDA (Non - GAAP) Note: Each adjustment has been taken directly from the income statement to derive adjusted EBITDA (Non - GAAP) for YoY operational comparisons. Interest income total is a component of Investment and other income on the income statement Past performance is not indicative of future results. There is no guarantee that any specific objective will be achieved. Inv est ments may be illiquid, highly speculative and there is risk of the total loss of your investment. KH0